
Ulu Gold Project, Nunavut, Canada
Based on the NI 43-101 Mineral Resource Estimate effective date of May 15, 2026, and independent modelling by Stormlands Mining
Introduction
Stormlands Mining’s independent analysis of the Ulu Gold Project in Nunavut demonstrates how a high-grade Mineral Resource Estimate can be converted into an illustrative economic model before a current Preliminary Economic Assessment has been completed.
The Ulu Gold Project is located in the Kitikmeot Settlement Area of western Nunavut and is owned by Blue Star Gold Corp. The updated NI 43-101 Technical Report has an effective date of May 15, 2026 and incorporates drilling completed between 2023 and 2025.
The purpose of this case study is not to replace a Preliminary Economic Assessment. It is to show how technical disclosure can be structured into a dynamic valuation framework that enables users to:
- derive an illustrative production and cost model;
- test commodity-price scenarios;
- examine discounted cash flow;
- identify the principal value drivers;
- quantify downside and upside sensitivities; and
- identify the technical assumptions that require further work.
The first scenario should be understood as a Stormlands report-based case, not an economic analysis published in the NI 43-101. It uses the Mineral Resource data and the US$3,350/oz gold-price applied in the technical report’s resource cut-off calculations, together with independent economic assumptions developed through the Stormlands modelling framework.
The second scenario keeps the same resource, production, recovery, cost, capital and discount-rate assumptions, but updates the gold price to US$4,877.40/oz (average of March 2026). This creates a clean comparison of Ulu’s leverage to gold price.
Resources
The Ulu Gold Project contains gold mineralization within several deposits and prospects along the Ulu Fold. The principal Mineral Resource areas are the Flood, Nutaaq and North Fold Nose zones.
At cut-off grades of 0.8 g/t Au for pit-constrained resources and 2.0 g/t Au for underground resources, the technical report states:
- Measured and Indicated: 2.204 Mt grading 7.87 g/t Au for 558,000 oz of gold.
- Inferred: 3.263 Mt grading 4.54 g/t Au for 476,000 oz of gold.
The Stormlands model is based on the 2.204 Mt Measured and Indicated resource and does not rely on the lower-confidence Inferred resource.
The technical report concludes that overall gold recovery above 90% may be achievable, while recommending further testwork to confirm variability and optimize processing across the different zones.
Ulu is a remote Arctic project. It is currently accessed by charter aircraft using an existing 1,350 m gravel airstrip. The site also includes a seasonal camp, limited road infrastructure, laydown areas and historical underground workings. These features provide a development starting point, but they do not remove the need for detailed engineering of power, logistics, access, processing, water, waste and closure requirements.
Base model
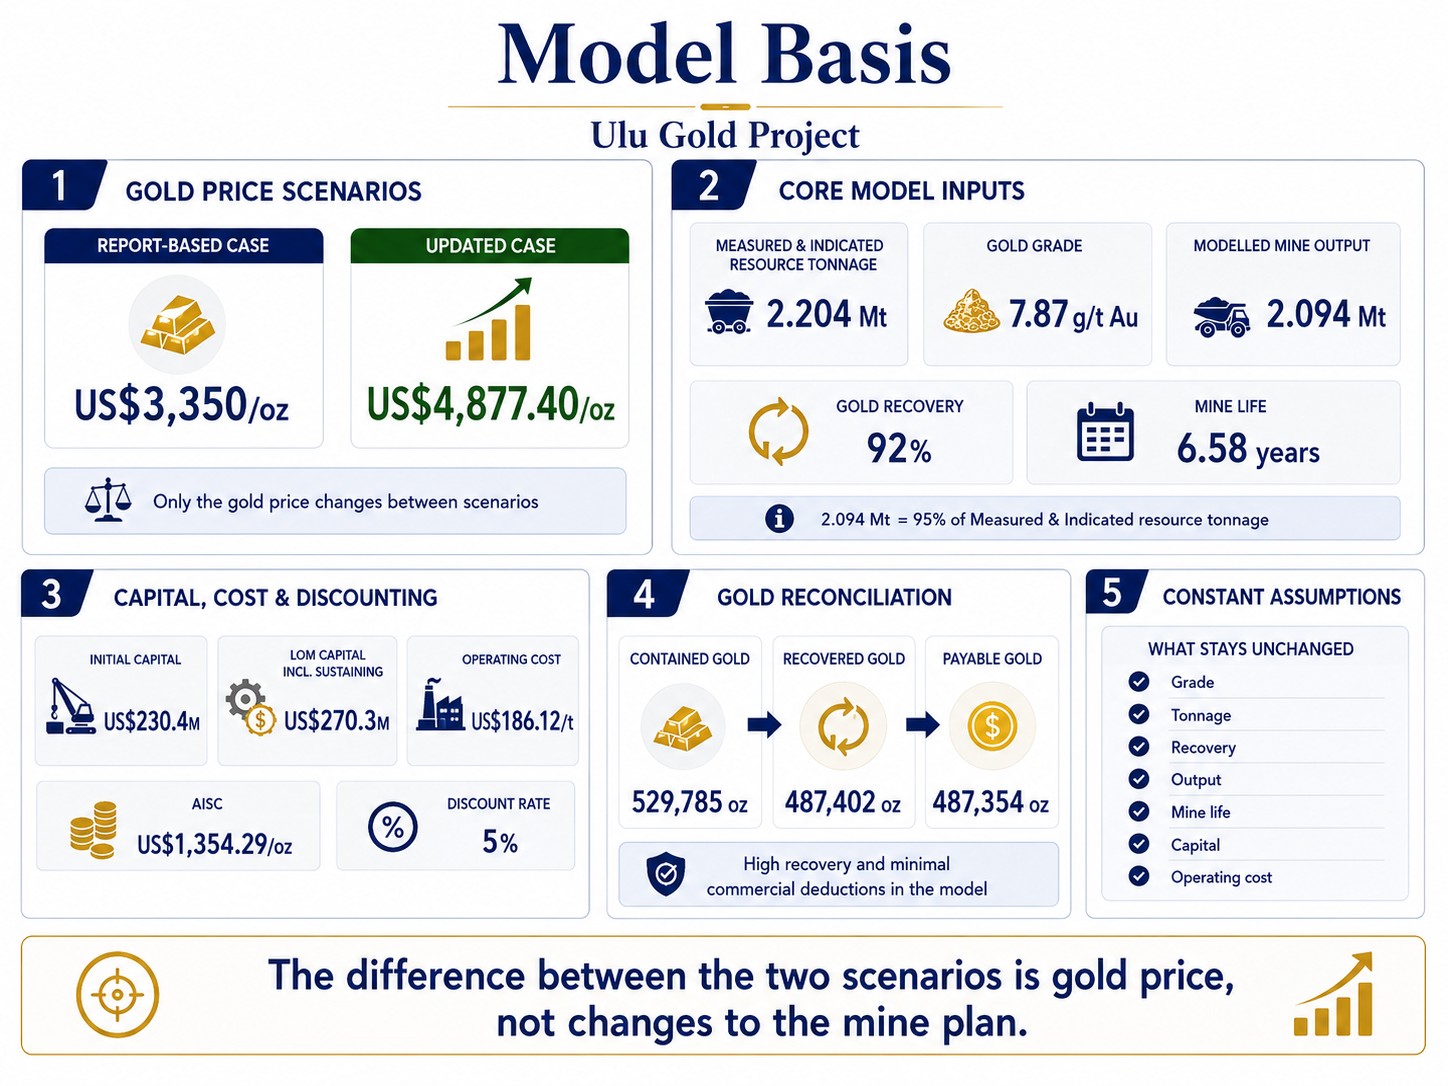
- Gold price – report-based case: US$3,350/oz
- Gold price – updated case: US$4,877.40/oz
- Measured and Indicated resource tonnage: 2.204 Mt
- Gold grade: 7.87 g/t Au
- Modelled mine output: 2.094 Mt
- Gold recovery: 92%
- Mine life: 6.58 years
- Initial capital: US$230.4 million
- Life-of-mine capital including sustaining capital: US$270.3 million
- Operating cost: US$186.12/t
- AISC: US$1,354.29/oz
- Discount rate: 5%
2.094 Mt, or 95% of the Measured and Indicated resource tonnage, is included in the illustrative production model.
The model contains 529,785 oz of contained gold, 487,402 oz of recovered gold and 487,354 oz of payable gold.
The difference between the scenarios is the gold price. The underlying grade, tonnage, recovery, output, mine life, capital and operating-cost assumptions do not change.
Key Highlights
1. The model produces strong economics
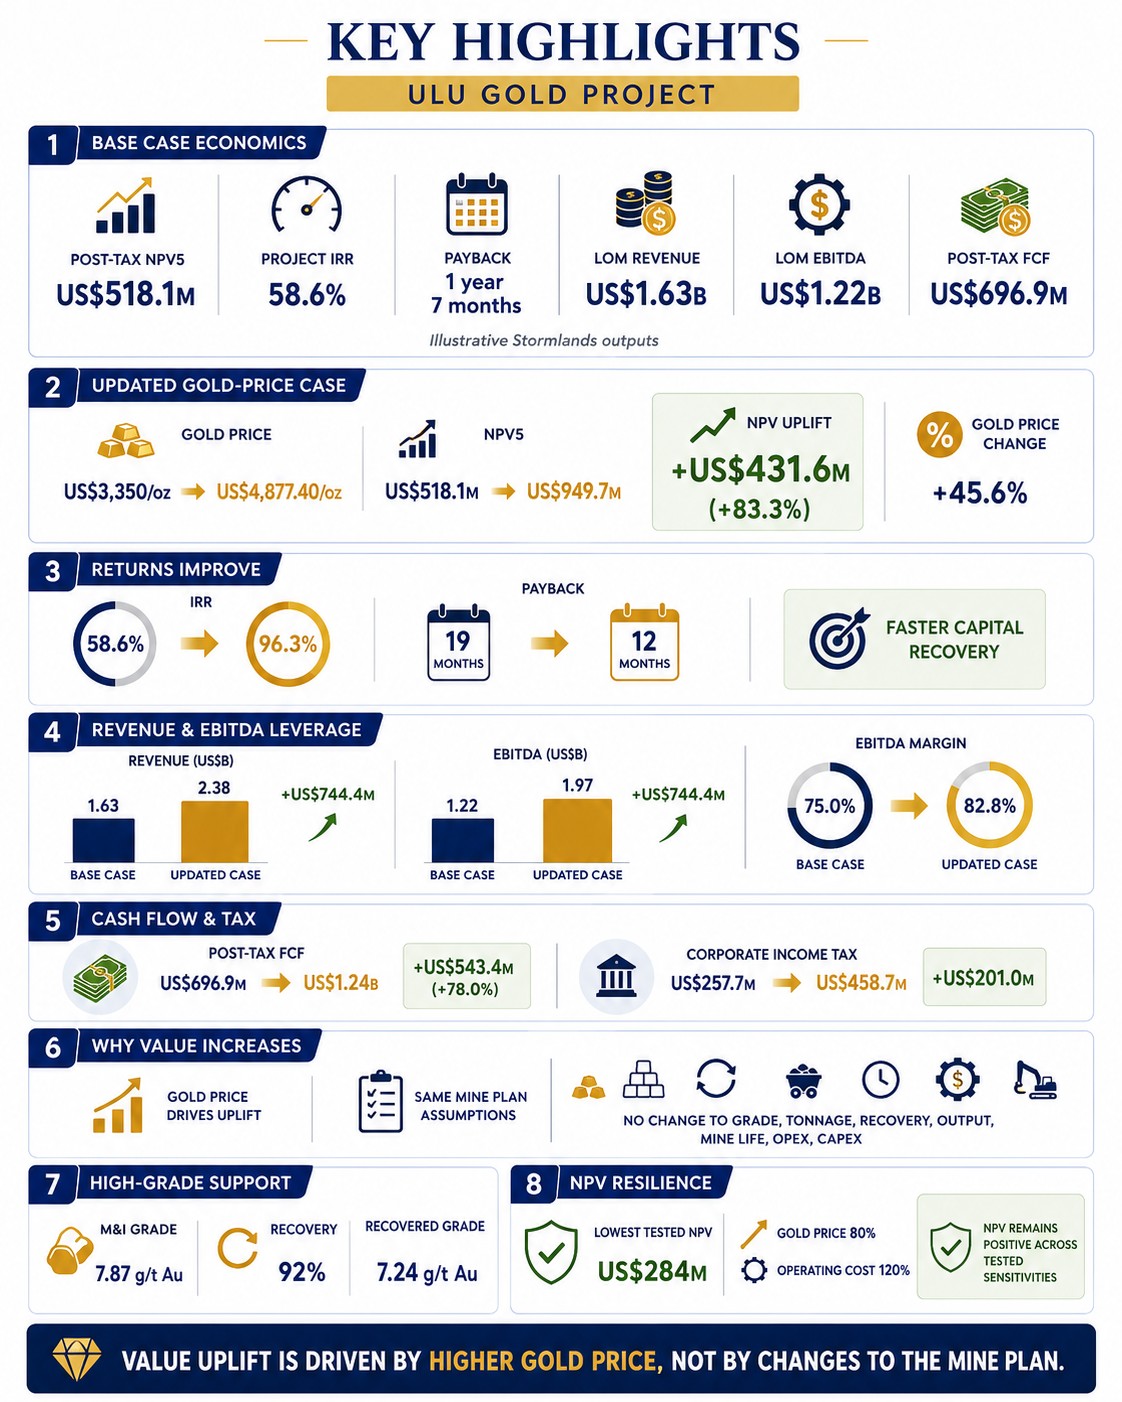
Using the US$3,350/oz gold-price applied in the technical report’s Mineral Resource calculations, Stormlands’ model produces:
- post-tax Project NPV5 of US$518.1 million;
- Project IRR of 58.6%;
- payback of one year and seven months;
- life-of-mine revenue of US$1.63 billion;
- life-of-mine EBITDA of US$1.22 billion; and
- post-tax project free cash flow of US$696.9 million.
(These figures are illustrative Stormlands outputs and are not economics published in the NI 43-101).
2. The updated gold-price case materially increases project value
Increasing the gold-price from US$3,350/oz to US$4,877.40/oz raises post-tax Project NPV5 from US$518.1 million to US$949.7 million. This is an increase of US$431.6 million, or 83.3%.
The percentage increase in NPV is materially greater than the 45.6% increase in gold price. This reflects Ulu’s fixed capital and operating-cost structure: once those costs are covered, a large proportion of incremental gold revenue flows through to cash flow and project value.
3. Project returns improve sharply
Project IRR increases from 58.6% to 96.3%. Payback improves from 19 months to 12 months.
The updated gold price therefore does more than increase the headline NPV. It accelerates the recovery of initial capital and reduces the period during which capital remains exposed to operating and execution risk.
4. Revenue and EBITDA leverage are substantial
Life-of-mine revenue increases from US$1.63 billion in the NI43-based case to US$2.38 billion in the updated commodity price case. The increase is US$744.4 million.
Life-of-mine EBITDA increases from US$1.22 billion to US$1.97 billion. Because operating expenditure is unchanged, the increase in EBITDA is also US$744.4 million. The EBITDA margin rises from 75.0% to 82.8%.
5. Post-tax cash flow increases by more than US$543 million
Post-tax project free cash flow increases from US$696.9 million to US$1.24 billion. This represents an increase of US$543.4 million, or 78.0%.
Corporate income tax increases from US$257.7 million to US$458.7 million, an increase of US$201.0 million. The updated commodity-price case therefore creates additional modelled value for the project while also materially increasing the corporate tax contribution.
6. The uplift is driven by price rather than a larger mine plan
The updated case does not assume a larger resource, higher grade, higher recovery, increased throughput, a longer mine life, lower operating costs or lower capital costs.
The valuation uplift is created by applying a higher gold price to the same illustrative physical plan. This allows users to isolate the effect of gold price, although it may understate the broader effect of a sustained higher-price environment. In a future engineering study, a lower economic cut-off grade could potentially change the mining inventory, sequencing or mine life.
7. The model is supported by high-grade gold exposure
The model is built around a Measured and Indicated grade of 7.87 g/t Au. At 92% recovery, the recovered gold-equivalent grade is 7.24 g/t Au.
The combination of high grade and strong recovered metal intensity allows the model to generate substantial revenue and operating margin from a relatively compact tonnage base.
8. NPV remains positive across every tested sensitivity scenario
In the two-variable heatmap, the lowest NPV occurs when gold price falls to 80% of the base assumption and operating costs increase to 120%. Even under this combined downside scenario, Project NPV remains US$284 million.
This indicates resilience within the specific ranges tested, although it should not be interpreted as confirmation of economic viability or as a substitute for a formal PEA.
Project NPV
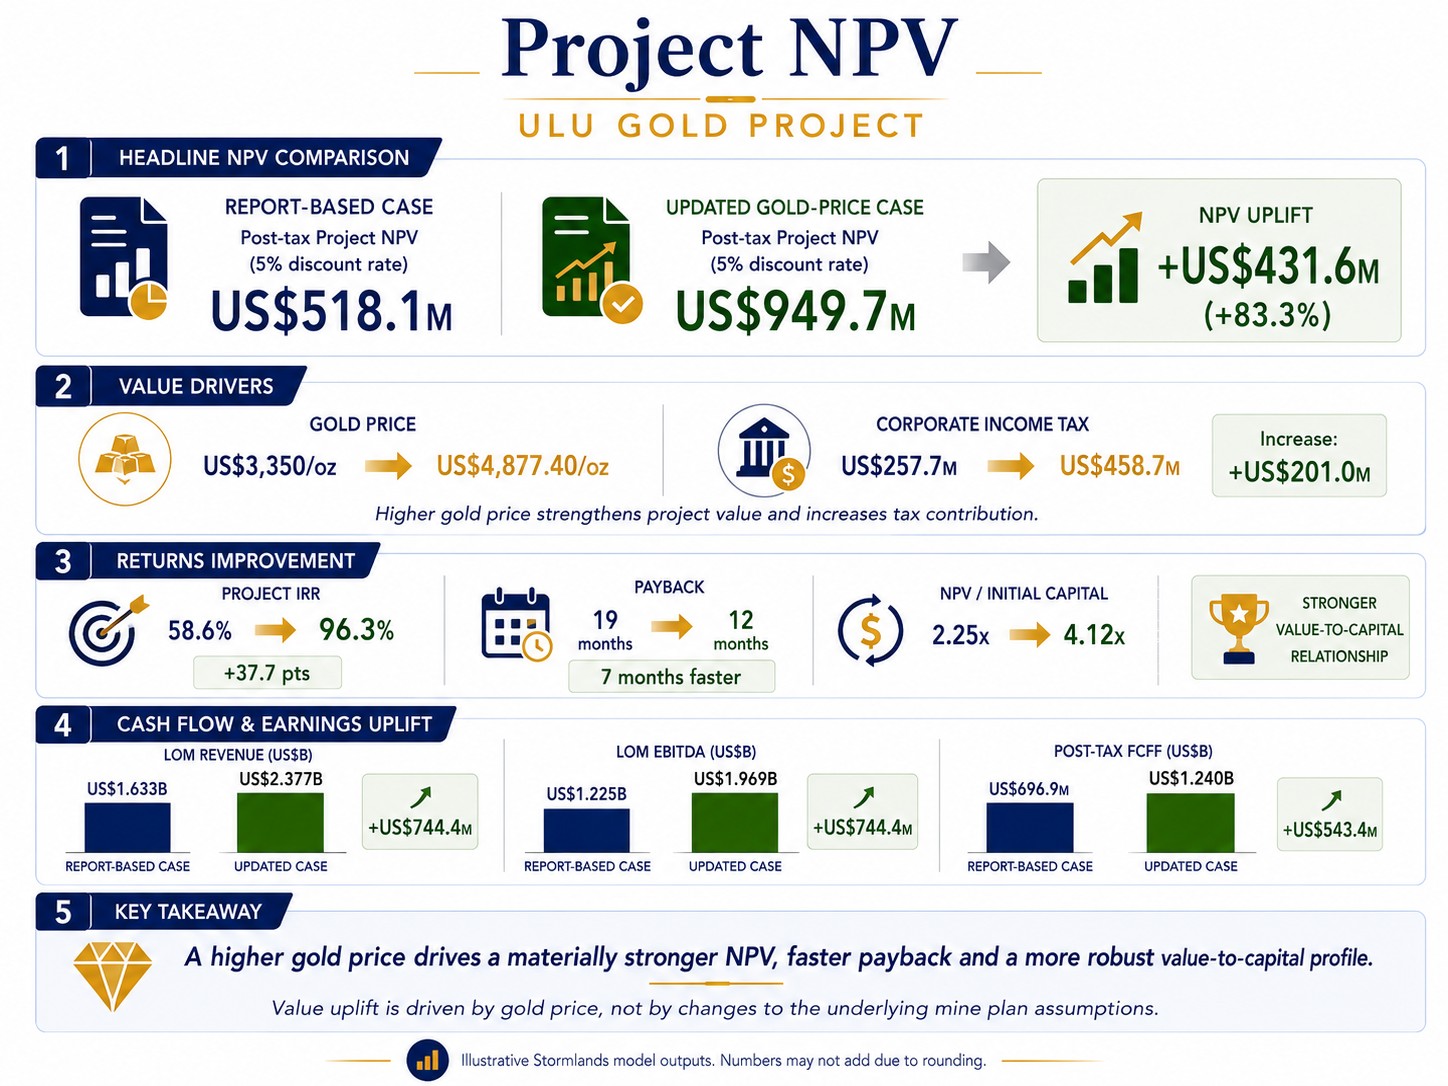
Stormlands’ report-based model produces a post-tax Project NPV of US$518.1 million at a 5% discount rate. The updated gold-price case produces a post-tax Project NPV of US$949.7 million.
- Gold price: US$3,350/oz in the report-based case and US$4,877.40/oz in the updated case
- Project NPV5: US$518.1 million and US$949.7 million; increase of US$431.6 million
- Project IRR: 58.6% and 96.3%; increase of 37.7 percentage points
- Payback: 19 months and 12 months; seven months faster
- Life-of-mine revenue: US$1.633 billion and US$2.377 billion; increase of US$744.4 million
- Life-of-mine EBITDA: US$1.225 billion and US$1.969 billion; increase of US$744.4 million
- Post-tax FCFF: US$696.9 million and US$1.240 billion; increase of US$543.4 million
- Corporate income tax: US$257.7 million and US$458.7 million; increase of US$201.0 million
NPV relative to initial capital increases from 2.25 times initial capital in the report-based case to 4.12 times initial capital in the updated price case. This is a significant strengthening of the project’s modelled value-to-capital relationship.
Price sensitivity
The updated gold price materially increases the value generated by each tonne of ore.
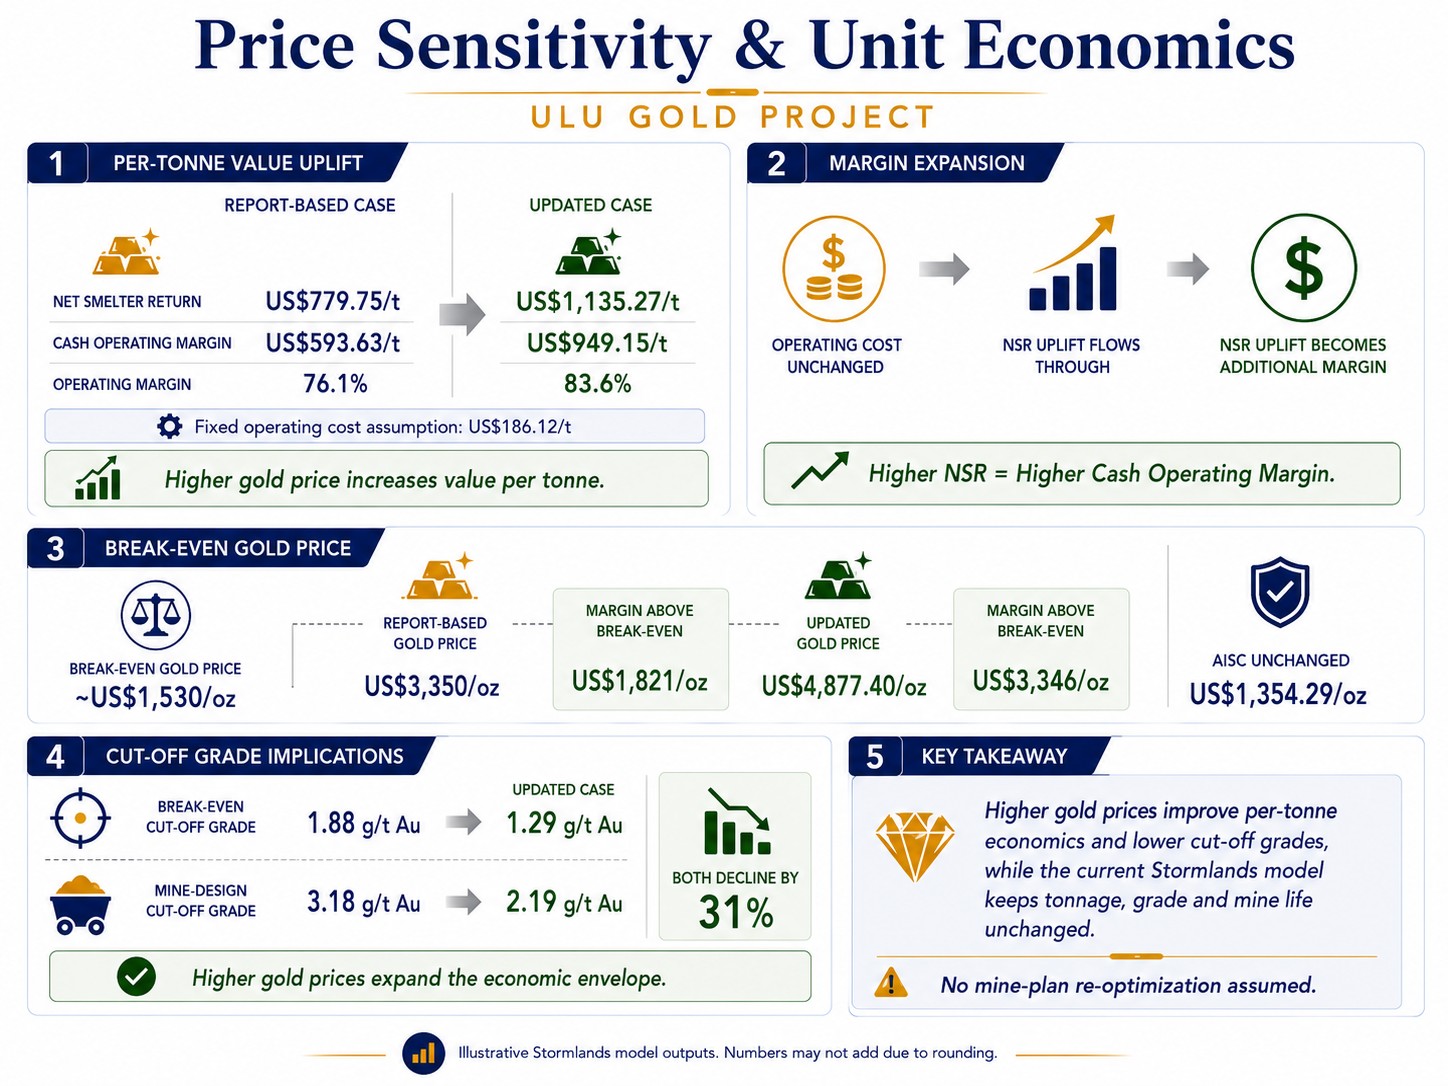
- Net smelter return: US$779.75/t in the report-based case and US$1,135.27/t in the updated case
- Cash operating margin: US$593.63/t and US$949.15/t
- Operating margin: 76.1% and 83.6%
Because the operating-cost assumption remains fixed at US$186.12/t, the full increase in net smelter return becomes additional cash operating margin.
Break-even gold price
The modelled break-even gold price remains close to US$1,530/oz in both scenarios. This provides an illustrative margin of US$1,821/oz relative to the report-based gold price and US$3,346/oz relative to the updated gold price.
The modelled AISC of US$1,354.29/oz is also unchanged between scenarios.
Cut-off-grade implications
The break-even gold cut-off grade falls from 1.88 g/t Au to 1.29 g/t Au. The modelled mine-design cut-off grade falls from 3.18 g/t Au to 2.19 g/t Au. Both decline by 31%.
This demonstrates how higher commodity prices can expand the economic envelope of a deposit. Lower cut-off grades could potentially provide additional mine-planning flexibility or support the inclusion of lower-grade material.
However, the current Stormlands model does not re-optimize the mine plan. Tonnage, grade and mine life remain unchanged. Any conclusion about additional mineable material would require engineering, geotechnical, metallurgical and economic evaluation.
DCF model insights
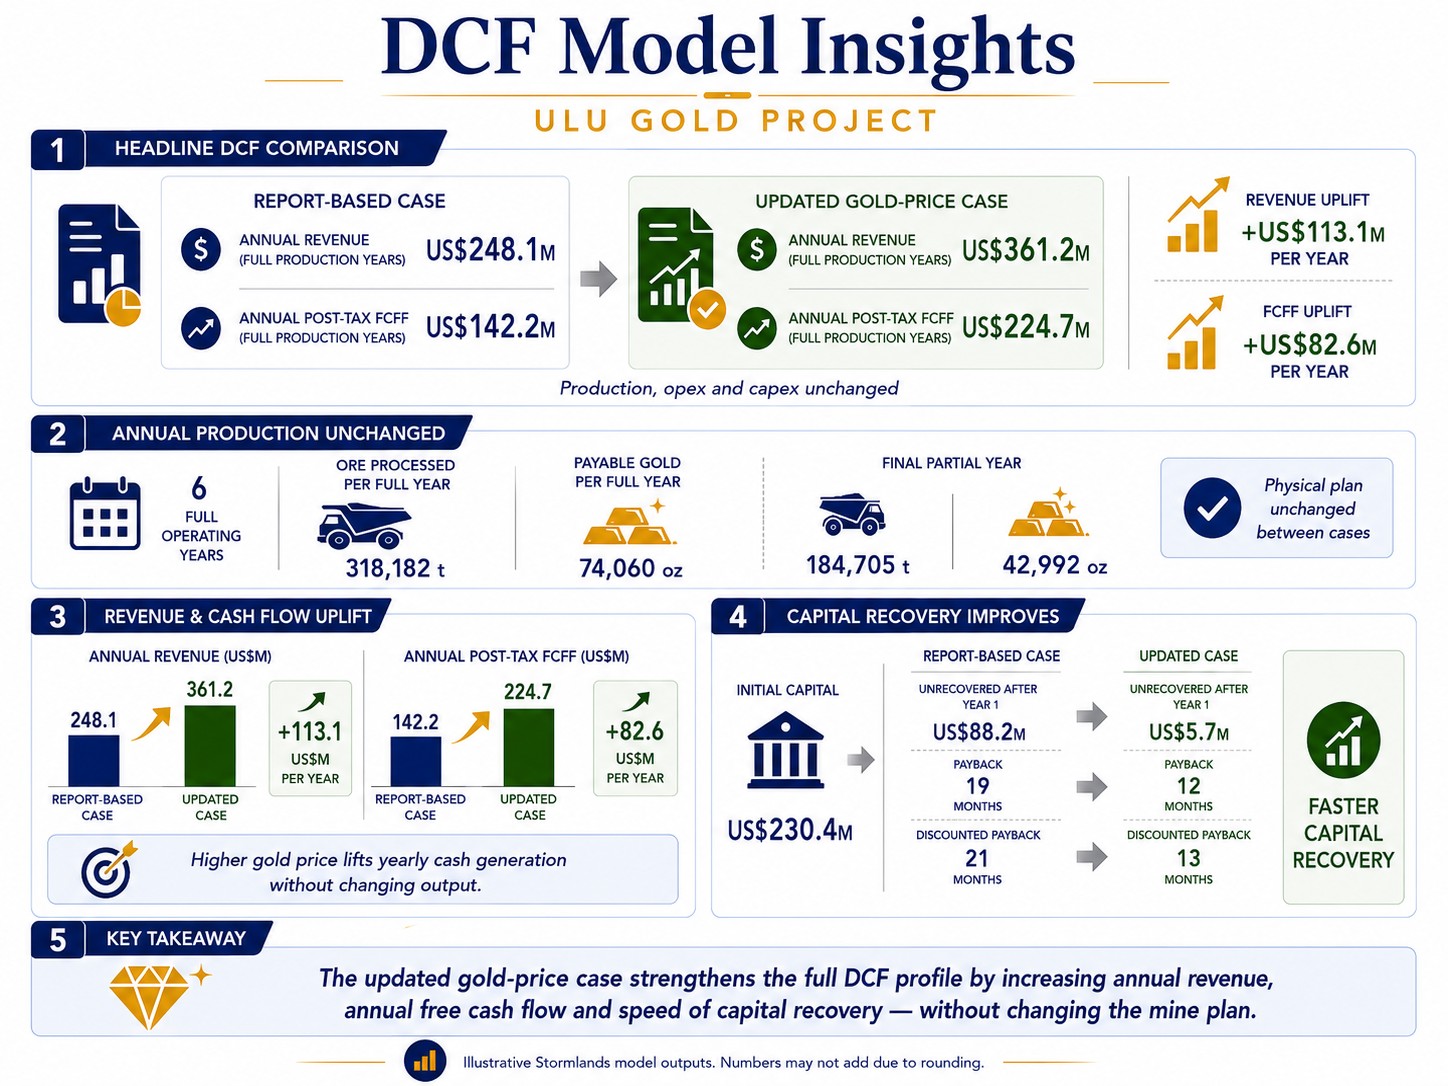
The discounted cash flow (DCF) comparison between the DCF model of the NI 43 and the DCF model with updated commodity prices shows that the updated gold-price case does not simply increase headline revenue. It materially improves the entire cash-flow profile.
Annual production remains unchanged
During each of the six full operating years, the project processes 318,182 tonnes of ore and produces 74,060 payable ounces of gold. The final partial operating year processes 184,705 tonnes and produces 42,992 payable ounces.
Annual revenue during the six full production years increases from US$248.1 million in the NI 43-based model to US$361.2 million with updated commodity prices. This is an increase of US$113.1 million per full operating year.
Annual post-tax free cash flow increases materially
Post-tax project free cash flow during each full operating year increases from US$142.2 million in the NI 43-based model to US$224.7 million in the model using updated commodity prices. The annual uplift is US$82.6 million before discounting.
This increase is generated without a change in production, operating costs or capital expenditure.
Capital recovery improves significantly
The model includes initial capital of US$230.4 million.
In the NI 43-based model, cumulative post-tax project cash flow remains US$88.2 million negative after the first full operating year. Initial capital is recovered during the second operating year, resulting in payback of 19 months.
In the updated scenario updated commodity prices, only US$5.7 million remains unrecovered after the first full operating year. Payback occurs almost immediately in the second operating year, producing a payback period of 12 months.
On a discounted basis, capital recovery improves from 21 months to 13 months. The updated gold price therefore reduces both nominal and discounted capital-recovery periods.
Stormlands Sensitivity Analysis
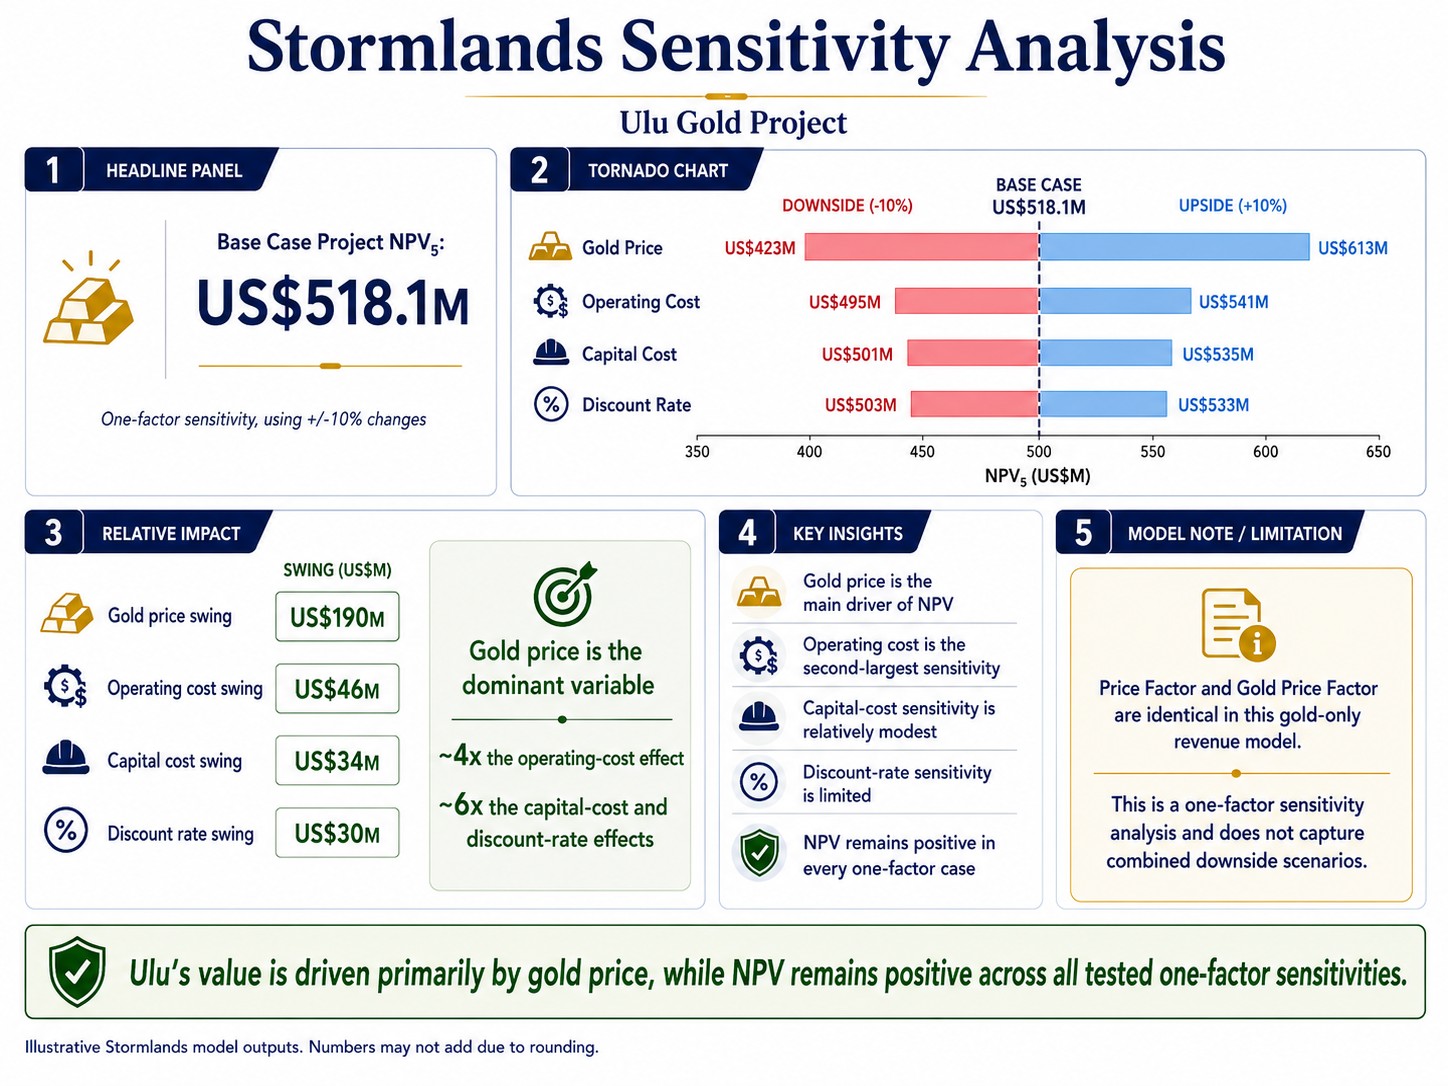
The sensitivity analysis produces a tornado chart illustrating the key factors that have greatest influence on NPV, using a 10 increase or decrease in value. The base case starts from a post-tax Project NPV5 of US$518.1 million.
- Gold price sensitivity (10% increase or decrease in gold price): NPV moves from US$423 million to US$613 million
- Operating-cost sensitivity (10% increase or decrease in operating cost): NPV moves from US$495 million to US$541 million
- Capital-cost sensitivity (10% increase or decrease in capital cost): NPV moves from US$501 million to US$535 million
- Discount-rate sensitivity (10% increase or decrease in discount rate): NPV moves from US$503 million to US$533 million
Gold price is the dominant variable
The tested gold-price range creates an NPV swing of US$190 million. By comparison, operating cost creates an NPV range of US$46 million, capital cost US$34 million, and discount rate US$30 million.
The gold-price effect is therefore four times the operating-cost effect and six times the capital-cost or discount-rate effect.
The sensitivity chart includes both a Price Factor and a Gold Price Factor, which produce identical results. This is expected in a gold-only revenue model: a change in the general commodity-price factor is effectively the same as a change in gold price.
Operating cost is the second-largest sensitivity
Operating cost remains important, particularly because Ulu is a remote Arctic project where aviation, power, logistics, labour, camp support and consumables may be expensive.
However, moderate operating-cost changes have a substantially smaller effect on NPV than comparable percentage changes in gold price. This reflects the high revenue and cash margin generated per tonne in the illustrative model.
Capital sensitivity is relatively modest
Capital-cost sensitivity moves NPV across a range of US$34 million. The result suggests that the model generates substantial cash flow relative to the initial capital assumption.
It does not mean capital accuracy is unimportant. The project has no current PEA, and the capital estimate has not been supported by detailed engineering. Infrastructure, processing, power, underground development, logistics, water management and closure costs require further validation.
Discount-rate sensitivity is limited
Discount-rate sensitivity produces the smallest NPV range. This reflects Ulu’s short modelled mine life and front-loaded cash-flow profile. Because most cash is generated early, less value is exposed to long-term discounting.
NPV remains positive in every individual scenario
The lowest one-factor sensitivity result is US$423 million. No individual factor within the tested range eliminates the modelled project value.
The sensitivity analysis nevertheless changes one variable at a time. It does not capture the combined effect of several adverse assumptions occurring together.
Stormlands Heatmap Analysis
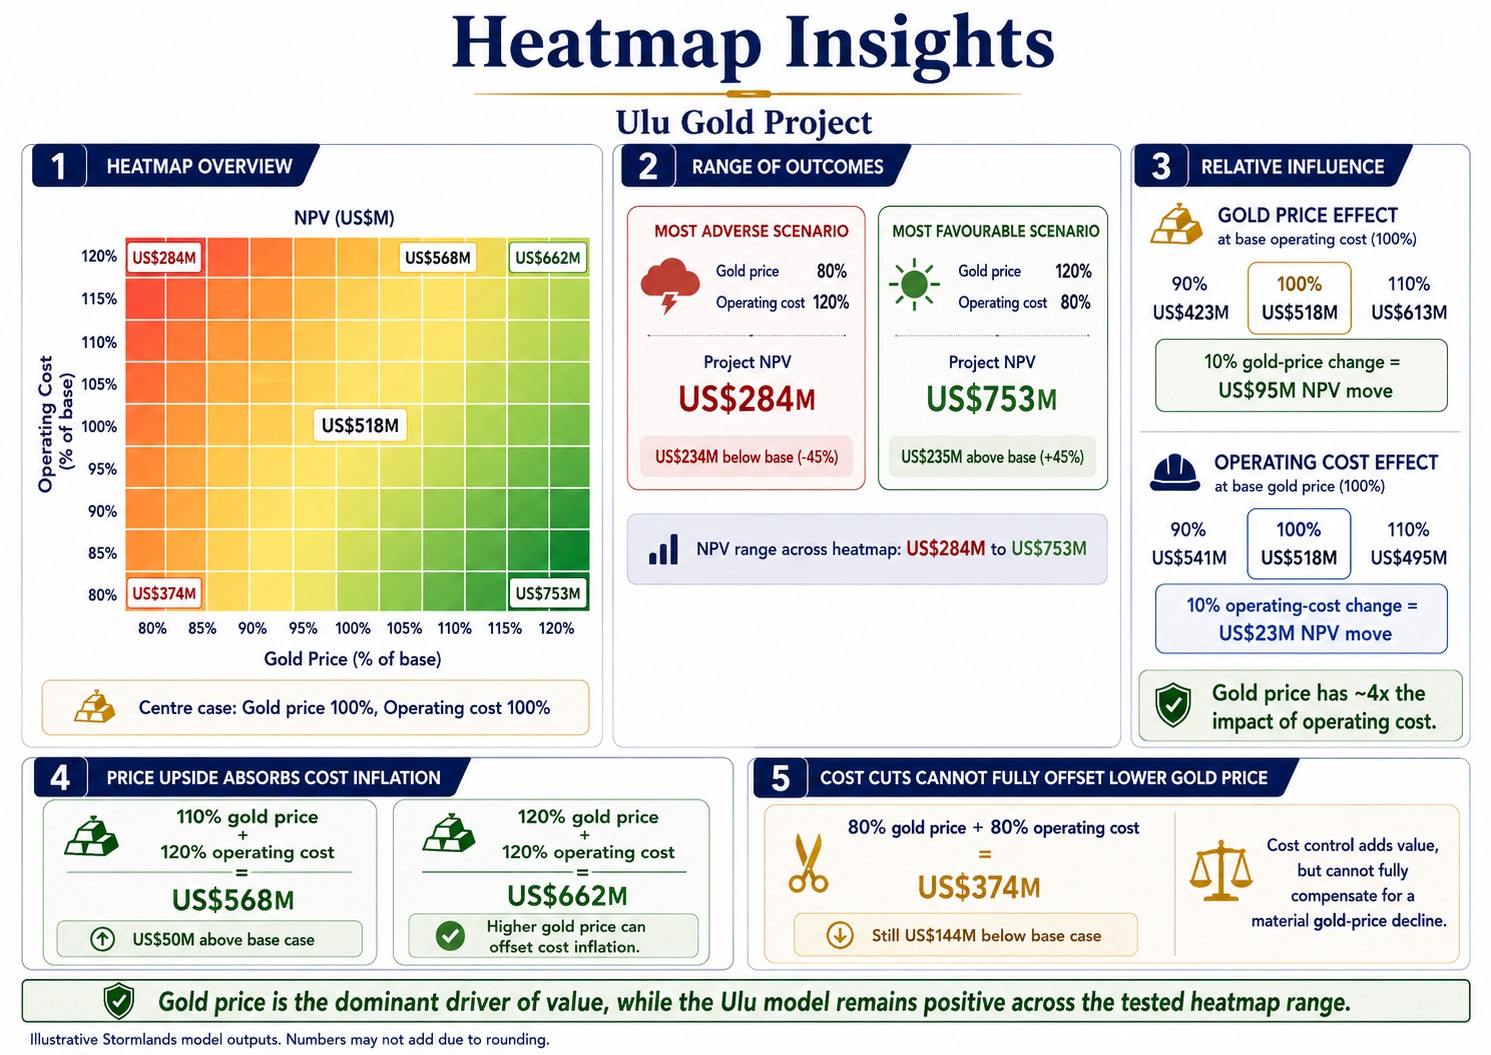
The heatmap examines gold price and operating cost simultaneously and varies both by +/-20%, +/-15% +/-10% +/-5%. At the centre of the analysis, gold price is 100%, operating cost is 100%, and Project NPV is US$518 million.
Across the full heatmap, NPV ranges from US$284 million in the most adverse scenario to US$753 million in the most favourable scenario.
Downside scenario
At 80% gold price and 120% operating cost, Project NPV falls to US$284 million. This is US$234 million, or 45%, below the base case.
While the result remains positive, it highlights that the most significant downside comes from the combination of a weaker gold price and cost inflation.
Upside scenario
At 120% gold price and 80% operating cost, Project NPV rises to US$753 million. This is US$235 million, or 45%, above the base case.
Gold price has four times the influence of operating cost
At base operating cost, reducing gold price by 10% lowers NPV from US$518 million to US$423 million, while increasing gold price by 10% raises NPV to US$613 million. A 10% gold-price change therefore moves NPV by US$95 million.
At base gold price, increasing operating cost by 10% lowers NPV to US$495 million, while reducing operating cost by 10% increases NPV to US$541 million. A 10% operating-cost change therefore moves NPV by US$23 million.
On a percentage-for-percentage basis, gold price has four times the impact of operating cost.
Higher gold prices can absorb significant cost inflation
At 110% gold price and 120% operating cost, Project NPV is US$568 million. This remains US$50 million above the base case, despite a 20% operating-cost increase.
At 120% gold price and 120% operating cost, NPV is US$662 million. This demonstrates that gold-price upside can more than offset comparable operating-cost inflation.
Cost reductions cannot fully offset a large gold-price decline
At 80% gold price and 80% operating cost, NPV is US$374 million. Even with operating costs reduced by 20%, the project remains US$144 million below the base NPV.
Cost control creates value, but it cannot fully compensate for a material decline in the gold-price assumption.
Value Drivers
1. Gold price
Gold price is the dominant value driver in the Ulu model. A 45.6% increase in gold price produces an 83.3% increase in NPV, a 60.8% increase in EBITDA, a 78.0% increase in post-tax project cash flow and a 37.7 percentage-point increase in IRR.
The sensitivity analysis and heatmap reach the same conclusion: the impact of gold price is substantially greater than the impact of operating cost, capital cost or discount rate.
Ulu is a gold-only revenue model. There are no material by-product credits in the Stormlands model to offset movements in the gold price.
2. High-grade gold exposure
The Measured and Indicated resource grade of 7.87 g/t Au is a central source of modelled value. The grade supports high net smelter return per tonne, strong operating margins, rapid capital recovery and resilience against moderate operating-cost changes.
At 92% recovery, the model produces 487,402 recovered ounces from 529,785 contained ounces. This level of metal intensity enables the project to generate significant cash flow from a relatively modest tonnage base.
3. Recovery and payable-metal conversion
The model assumes 92% gold recovery, consistent with the recovery assumption used in the technical report’s Mineral Resource cut-off calculations and with its conclusion that recovery above 90% may be achievable.
Recovered and payable gold are almost identical in the model: 487,402 recovered ounces and 487,354 payable ounces. This means the model assumes negligible commercial deductions, treatment charges, refining charges or payable losses. That assumption should be confirmed in future commercial and metallurgical work.
4. Payback and early cash flow
The front-loaded cash-flow profile is one of the strongest features of the illustrative model. The NI43-based case shows US$142.2 million of post-tax free cash flow in each full production year, while the updated case using updated commodity prices generates US$224.7 million.
Payback occurs during the second operating year in both cases and improves from 19 months to 12 months. This rapid recovery reduces the model’s reliance on late-life cash flow and helps explain why discount-rate sensitivity is relatively limited.
5. Operating cost and Arctic logistics
Operating cost is the second-largest sensitivity, but its effect remains much smaller than gold price. The model assumes operating cost of US$186.12/t and life-of-mine operating expenditure of US$389.7 million.
The heatmap indicates that a 20% operating-cost increase reduces NPV by US$45 million at the base gold price.
Ulu’s location makes operating-cost validation especially important. Aviation, diesel power, seasonal access, labour rotation, camp operation, consumables, freight and waste management could materially affect final costs.
The existing airstrip, camp, roads and historical workings are potentially valuable, but their condition, capacity and suitability for a future mining operation require engineering assessment.
6. Capital and infrastructure
The model assumes initial capital of US$230.4 million and total life-of-mine capital of US$270.3 million. This implies sustaining capital of US$39.9 million.
Capital sensitivity is relatively moderate in the current model, but the underlying estimate is not supported by a current PEA.
Future technical work must determine the required investment in underground and potentially open-pit development, processing facilities, power generation and fuel storage, accommodation and site services, airstrip and road upgrades, water and waste management, tailings or residue management, communications, closure and reclamation, and Arctic logistics.
The proposed Grays Bay road and port corridor could potentially change the long-term logistics context, but no benefit from that proposed infrastructure should be assumed in the valuation unless access, timing and commercial terms become sufficiently defined.
7. Resource conversion and future scale
The Stormlands model is based only on the 558,000 oz Measured and Indicated resource. The additional Inferred resource contains 476,000 oz at 4.54 g/t Au and is excluded from the model.
Inferred resources have a lower level of geological confidence and cannot be converted directly into Mineral Reserves. However, they create a clear future work question: how much of the Inferred resource could be upgraded, and how would that affect mine life, scale, capital efficiency and the development strategy?
The technical report also identifies expansion potential around the Flood Zone and numerous peripheral zones and showings. The current model therefore tests a defined Measured and Indicated inventory rather than the full geological potential of the project.
8. Tax, royalties and fiscal completeness
Corporate income tax increases from US$257.7 million to US$458.7 million in the updated gold-price case.
However, the model currently includes no commercial royalty payments, no government production royalties, no resource rent tax, no state participation and no working-capital requirement.
The technical report describes different royalty arrangements across the Ulu Mining Lease and Hood River Property. The Ulu Mining Lease is subject to a 5% net-proceeds royalty after the recovery of 675,000 oz of gold, while the Hood River Property is subject to a 3% NSR, with an option to repurchase part of that royalty under specified terms.
Because the model produces 487,354 payable ounces, the 675,000 oz threshold is not reached in the current illustrative plan. However, a portion of the resource is located on the Hood River Property. A zone-by-zone mine plan is therefore required to determine the appropriate royalty treatment.
Applicable Nunavut government royalties and other fiscal charges should also be incorporated into a more advanced model.
Development questions
Mine plan and production schedule
A PEA should determine:
- the appropriate split between open-pit and underground extraction;
- mining method and stope design;
- geotechnical assumptions;
- dilution and mining recovery;
- development metres;
- production sequencing;
- stockpiling strategy; and
- the proportion of each Mineral Resource zone included in the mine plan.
Metallurgy and processing
Further work is required to confirm:
- recovery by zone and material type;
- variability across Flood, Nutaaq and North Fold Nose;
- grinding requirements;
- gravity, flotation and cyanidation options;
- reagent consumption;
- arsenic and sulphide management;
- tailings characteristics; and
- the preferred process flowsheet.
Infrastructure and logistics
A future study must define:
- power supply;
- annual freight requirements;
- aviation capacity;
- road and airstrip upgrades;
- camp and accommodation;
- water supply;
- waste and tailings facilities;
- fuel storage; and
- the potential effect of future regional infrastructure.
Environment, permitting and closure
The project has a long exploration and advanced-development history and ongoing reclamation requirements. A formal study must incorporate:
- acid rock drainage and metal-leaching management;
- closure and reclamation costs;
- legacy infrastructure;
- water treatment;
- environmental baseline work;
- permitting requirements;
- Inuit participation and benefit arrangements; and
- long-term monitoring obligations.
Commercial and fiscal assumptions
The next stage of modelling should include:
- zone-specific royalties;
- applicable government royalties;
- refining and commercial deductions;
- working capital;
- financing scenarios;
- closure security;
- tax depreciation and loss treatment; and
- sensitivity to exchange rates.
Conclusion
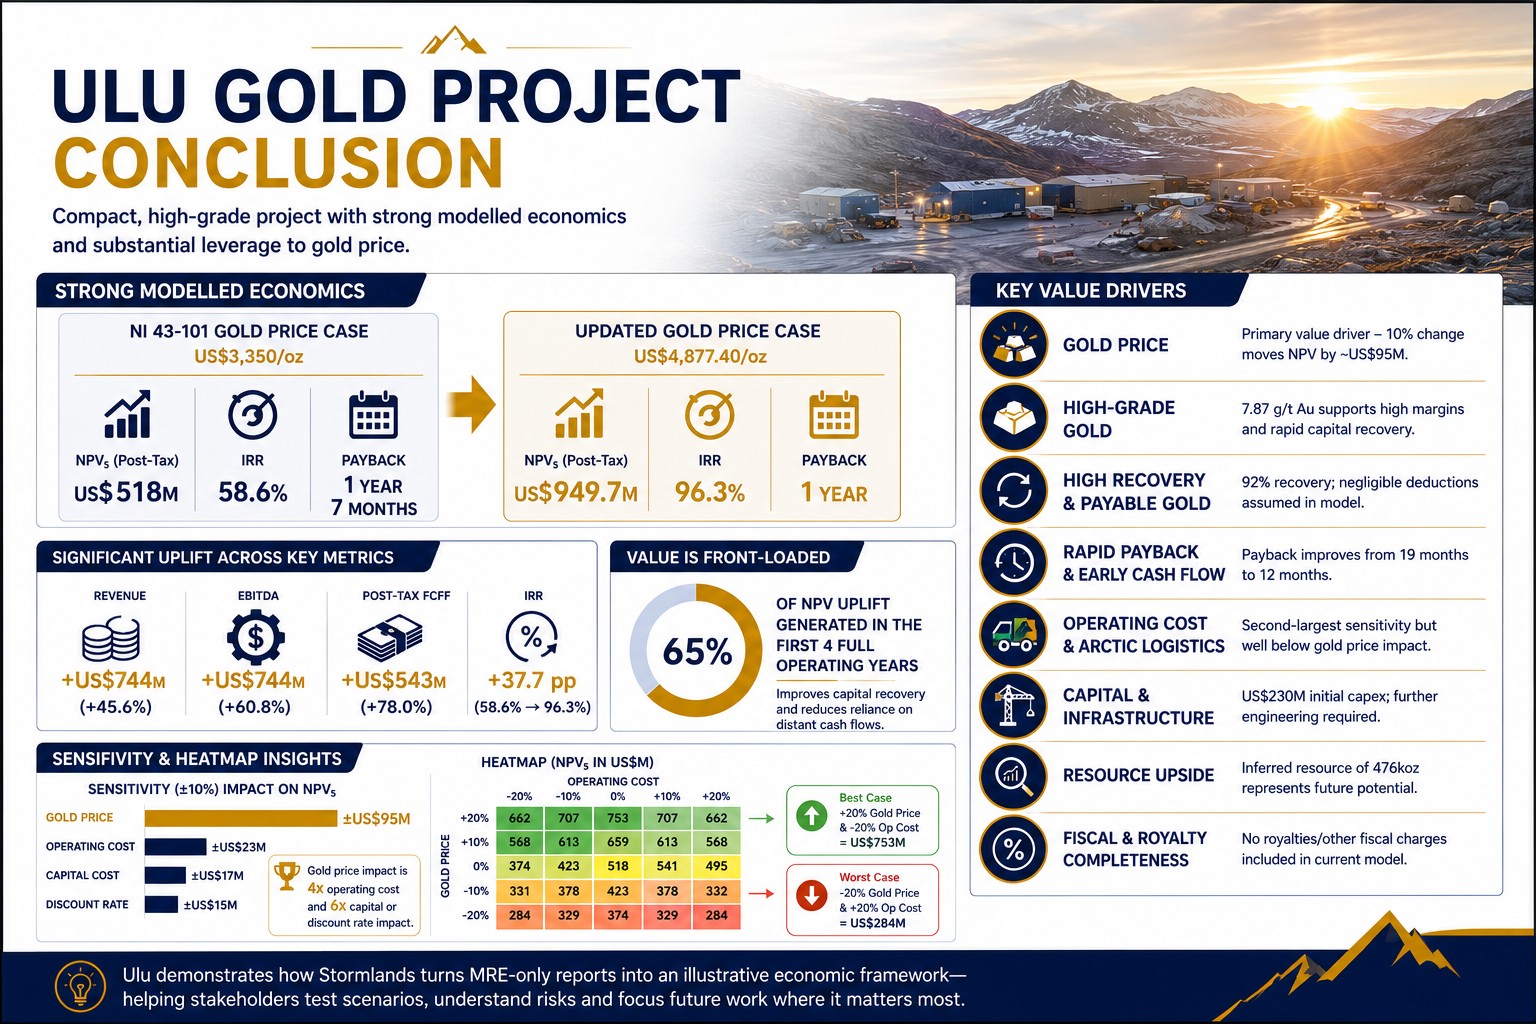
Stormlands’ illustrative model of the Ulu Gold Project shows a compact, high-grade gold project with strong modelled economics and substantial leverage to gold price.
Using the Measured and Indicated resource and the US$3,350/oz gold-price applied in the technical report’s resource calculations, the model produces a post-tax Project NPV5 of US$518.1 million, Project IRR of 58.6%, and payback of one year and seven months.
Under the updated gold-price scenario, Project NPV increases to US$949.7 million, IRR increases to 96.3%, and payback shortens to one year.
Life-of-mine revenue increases by US$744.4 million, while post-tax project free cash flow increases by US$543.4 million.
The DCF model shows that the increase in value is front-loaded. 65% of the NPV uplift is generated during the first four full operating years, directly improving capital recovery and reducing reliance on distant cash flows.
The sensitivity analysis and heatmap confirm that gold price is the principal value driver. Operating cost, capital cost and discount rate matter, but comparable percentage changes in those variables have a much smaller effect on valuation.
The broader insight is more important than the individual numbers. Ulu demonstrates how Stormlands can take an MRE-only technical report and create an illustrative economic framework before a current PEA exists.
This gives analysts, investors and project teams a way to test scenarios, understand economic leverage, identify the principal risks, examine when value is generated, and determine which technical questions should be addressed next.
For development-stage mining projects, dynamic modelling does not replace formal technical studies. It helps decision-makers understand the economic implications of technical disclosure and focus future work on the assumptions that matter most.
About Stormlands
Stormlands Mining is an AI-first valuation and analytics platform for mining assets and critical minerals. The platform helps users turn technical disclosures into interactive valuation models in minutes, rather than days or weeks. The valuation models are accessible over multiple platforms to all users, enabling the user to interact directly with the data to facilitate scenario-planning.
The platform enables users to build discounted cash flow models at scale, test commodity price, capex, opex, tax, royalty rates, discount-rates and production scenarios, and compare opportunities and scenarios.
Stormlands is using this technology to build the Stormlands Library: a global repository of mining asset valuation models. It has moved beyond a tool for analysts building individual models and is developing a data layer for the mining industry: a structured source of valuation models and illustrative scenarios. This creates a new way for investors, corporates, professional advisers, financial-market users and public-policy stakeholders to screen assets, benchmark projects and understand the key drivers of mining asset economics.
If you are interested in accessing the models in the library, email ceo@stormlandsmining.com
Important Notice
This analysis has been prepared by Stormlands Mining using publicly available information from the NI 43-101 Technical Report together with Stormlands’ own independent modelling assumptions.
The analysis is illustrative only. It is not a Preliminary Economic Assessment, Pre-Feasibility Study, Feasibility Study, Mineral Reserve estimate or independent technical report. It has not been prepared on behalf of the project owner and has not been reviewed or approved by the project owner.
The model outputs are Stormlands-generated illustrative estimates only. They should not be interpreted as demonstrated economic viability. Future technical work, including mine planning, metallurgical testing, engineering, environmental studies, permitting, capital-cost estimation and operating-cost estimation, would be required before any formal economic conclusions could be drawn.