
Odienné Gold Project, Côte d'Ivoire, West Africa
Based on the NI 43-101 Technical Report, effective 1 April 2026, and independent modelling by Stormlands Mining
Download the full case study here
Introduction
Stormlands Mining’s analysis of the Odienné Gold Project shows how a publicly available NI 43-101 Technical Report can be converted into an illustrative economic model before a formal Preliminary Economic Assessment has been published. The technical report provides the project’s Mineral Resource Estimate. It does not provide a project-level economic assessment, detailed mine plan or feasibility-level cost estimate.
Stormlands used the data from the NI 43-101 Technical Report, effective 1 April 2026, as the foundation for a discounted cash flow (DCF) model. It uses the Mineral Resource data and the US$3,000/oz gold-price and the copper price of US$9,568/t, referenced in the NI 43-101 resource cut-off calculations, together with independent economic assumptions developed through the Stormlands modelling framework.
Stormlands then created a scenario using the average of March 2026 commodity prices: US$4,877.40/oz and the copper to US$12,498.98/t, but keeping the same resource, production, recovery, cost, capital and discount-rate.
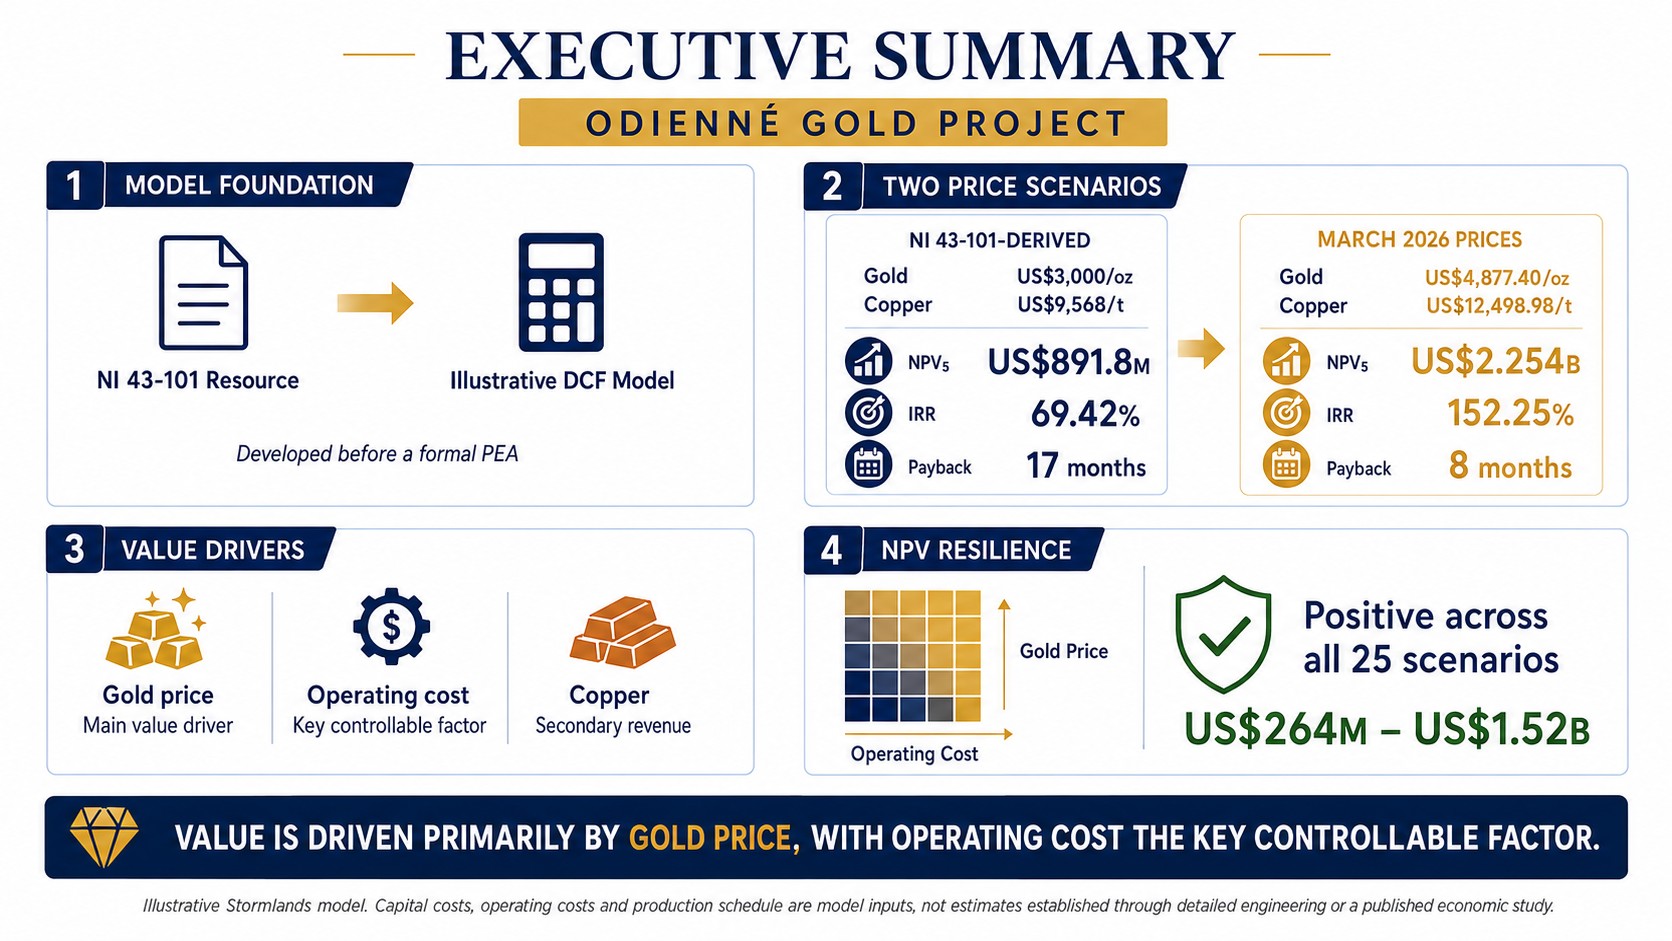
Under the NI 43-101-derived price scenario, the model produces an illustrative post-tax NPV of US$891.8 million at a 5% discount rate and an IRR of 69.42%. Under updated commodity prices, NPV increases to US$2.254 billion and IRR rises to 152.25%. The modelled payback period shortens from approximately 17 months to eight months.
The analysis identifies gold price as the main individual driver of project value. Operating cost is the most important controllable factor, while copper provides meaningful but secondary revenue. Across the 25 gold-price and operating-cost combinations tested in the heatmap, NPV remains positive and ranges from approximately US$264 million to US$1.52 billion.
Capital costs, operating costs and the production schedule are Stormlands model inputs and have not been established through detailed engineering or a published economic study.
Project context
The Odienné Project is located in northwestern Côte d’Ivoire. The NI 43-101 Technical Report, effective 1 April 2026, is the first independent technical report on the project.
The combined Mineral Resource comprises:
- 4 million tonnes
- 33 g/t gold
- 29% copper
- Approximately 1.389 million ounces of contained gold
- Approximately 93,000 tonnes of contained copper
- Approximately 1.707 million ounces of gold equivalent at 1.64 g/t AuEq
The technical report describes the project as being at an early stage of exploration and evaluation. Only part of the broader property has been tested, creating potential for additional discoveries and resource growth. This exploration upside is not included in the Stormlands DCF model.
Model Framework
The Stormlands model compares two scenarios:
- NI 43-101-derived price scenario: gold at US$3,000/oz and copper at US$9,568/t.
- Updated commodity-price scenario: gold at US$4,877.40/oz and copper at US$12,498.98/t.
The following assumptions remain unchanged in both cases:
| Assumption | Both scenarios |
| Modelled mine output | 32.40 Mt |
| Mine life | 7.09 years |
| Gold grade | 1.33 g/t |
| Copper grade | 0.29% |
| Initial CAPEX | US$300.0m |
| LOM CAPEX including sustaining capital | US$405.1m |
| LOM OPEX | US$1.988bn |
| Unit OPEX | US$61.36/t |
| Discount rate | 5% |
Because the principal technical and cost assumptions remain unchanged, the comparison isolates the impact of changing commodity prices on the modelled project economics.
Key Highlights
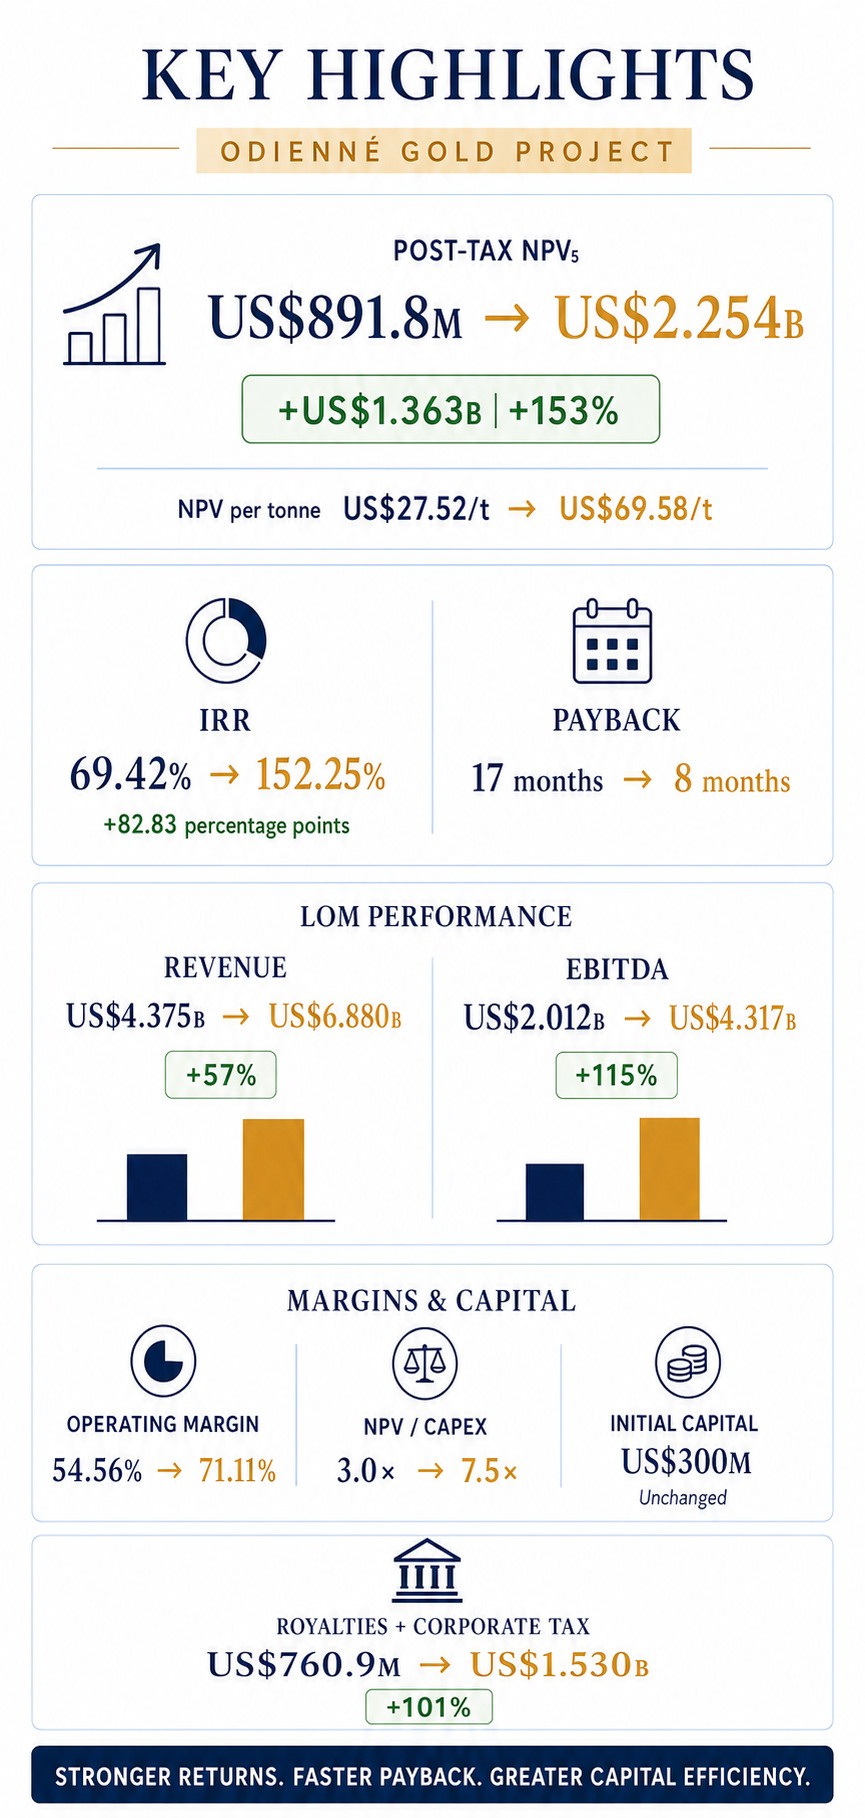
NPV increases by US$1.36 billion. Post-tax NPV rises from US$891.8 million to US$2.254 billion, an uplift of about US$1.363 billion or 153%. NPV per tonne increases from US$27.52/t to US$69.58/t.
IRR increases from 69% to 152%. The project IRR increases by 82.83 percentage points as higher early cash flows are generated against the same US$300 million initial investment.
Payback shortens to eight months. The modelled payback period improves from 17 months to eight months, reducing the period during which the initial investment remains exposed to operating and commodity-price risks.
Revenue rises by 57%. Life-of-mine revenue increases from US$4.375 billion to US$6.880 billion, an increase of US$2.505 billion.
EBITDA more than doubles. Life-of-mine EBITDA increases from US$2.012 billion to US$4.317 billion, an uplift of 115%. The gain is greater than the revenue increase because the modelled operating-cost structure is unchanged.
Operating margins strengthen. Net Smelter Return increases from US$135.02/t to US$212.35/t, cash operating margin rises from US$73.67/t to US$150.99/t, and operating margin increases from 54.56% to 71.11%.
Capital efficiency improves. The relationship between NPV and initial CAPEX increases from 3.0x to 7.5x, while initial capital remains US$300 million.
Government revenues more than double. Modelled government royalties and corporate income tax increase from US$760.9 million to US$1.530 billion, an uplift of about 101%.
DCF model results
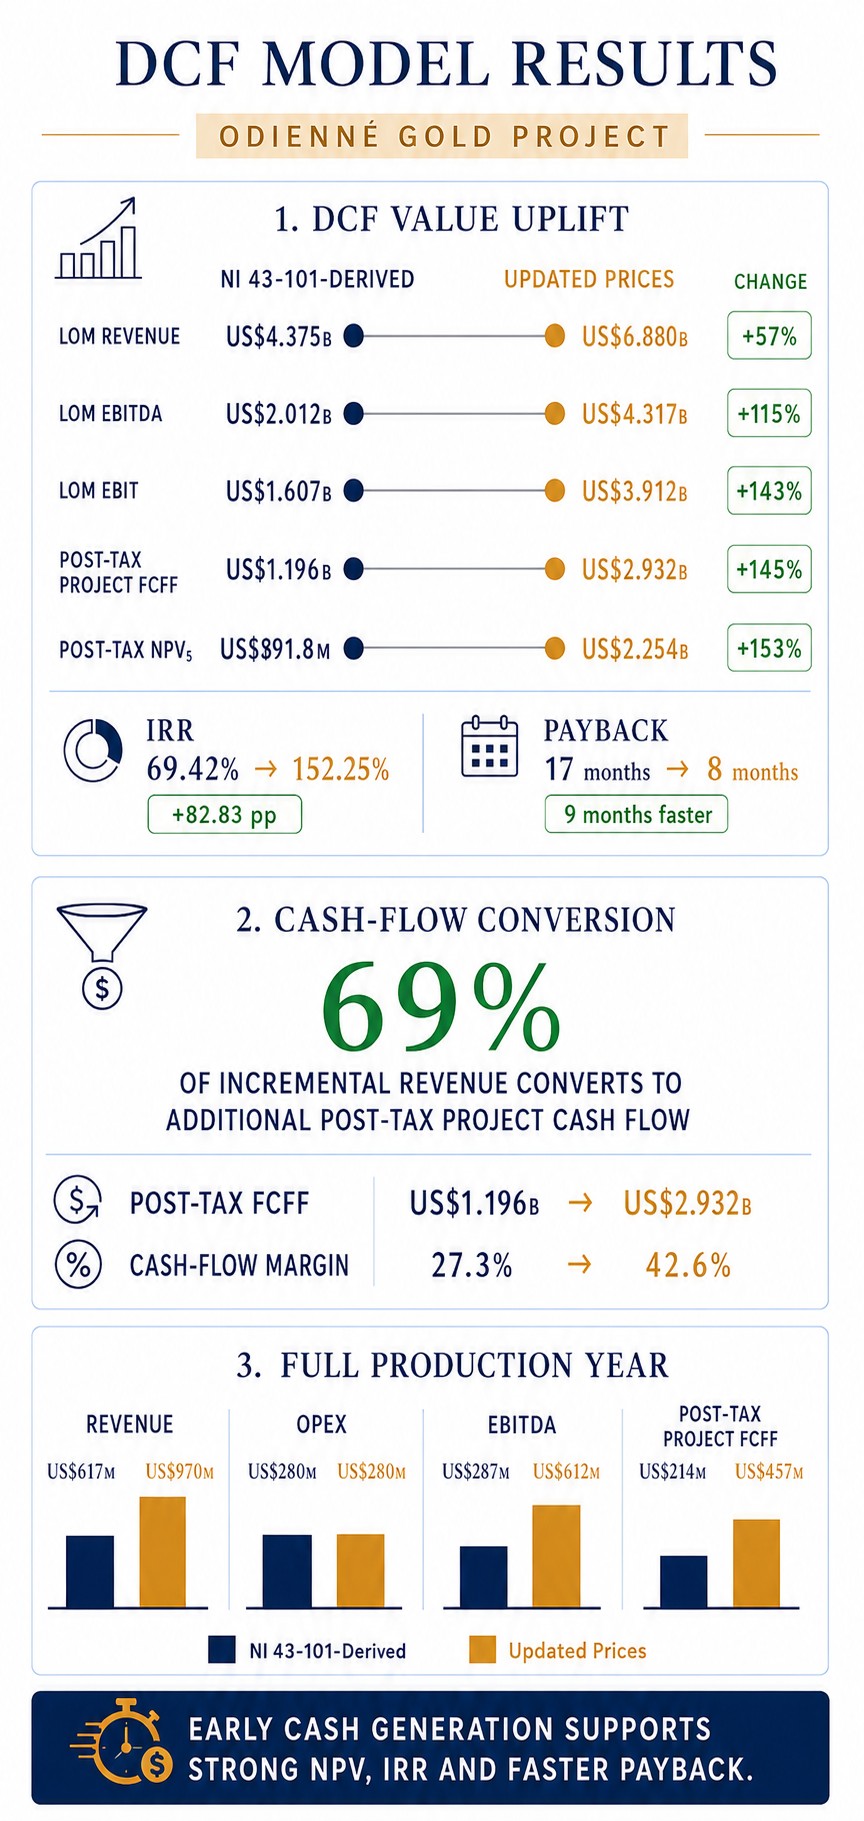
| DCF output | NI 43-101-derived case | Updated-price case | Change |
| LOM revenue | US$4.375bn | US$6.880bn | +57% |
| LOM EBITDA | US$2.012bn | US$4.317bn | +115% |
| LOM EBIT | US$1.607bn | US$3.912bn | +143% |
| Post-tax project FCFF | US$1.196bn | US$2.932bn | +145% |
| Post-tax NPV at 5% | US$891.8m | US$2.254bn | +153% |
| Project IRR | 69.42% | 152.25% | +82.83 pp |
| Payback | Approx. 17 months | Approx. 8 months | 9 months faster |
Cash-flow conversion
Post-tax project free cash flow increases from US$1.196 billion to US$2.932 billion. 69% of the incremental revenue in the updated-price scenario converts into additional post-tax project cash flow. The post-tax cash-flow margin increases from 27.3% to 42.6% of revenue.
Early cash generation
During a full production year, the model produces approximately:
| Full production year | NI 43-101-derived case | Updated-price case |
| Revenue | US$617m | US$970m |
| OPEX | US$280m | US$280m |
| EBITDA | US$287m | US$612m |
| Post-tax project FCFF | US$214m | US$457m |
The short mine life and concentration of cash generation in the early production years help explain the strong NPV, IRR and payback results and the relatively limited sensitivity to changes in the discount rate.
Value drivers
Overall commodity-price factor
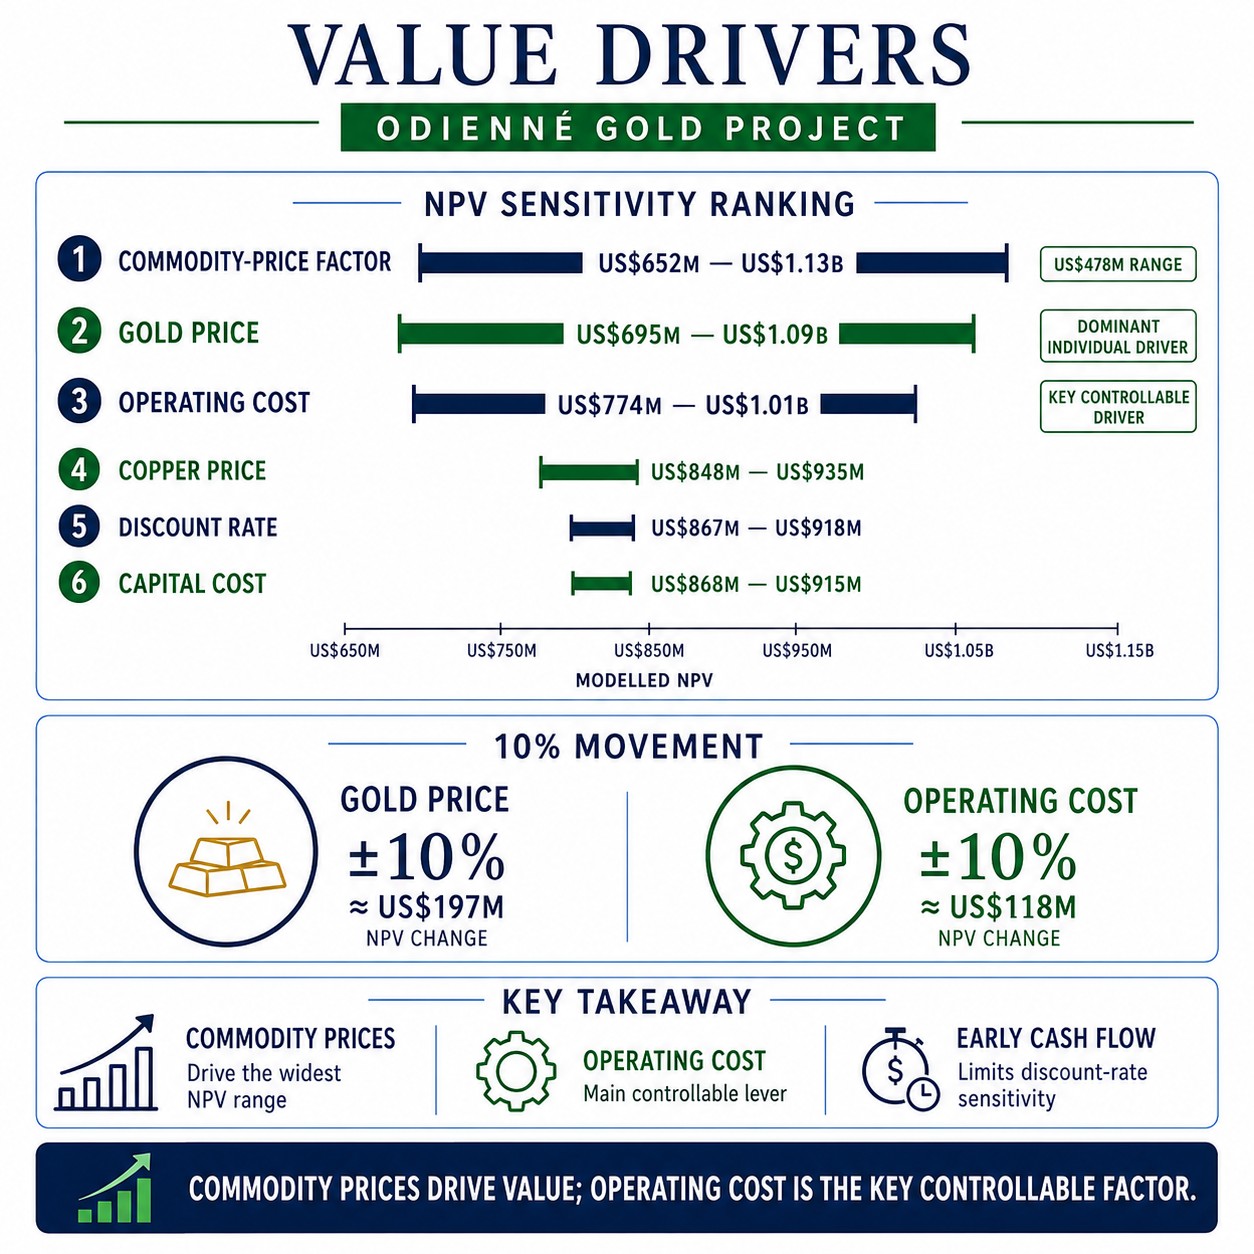
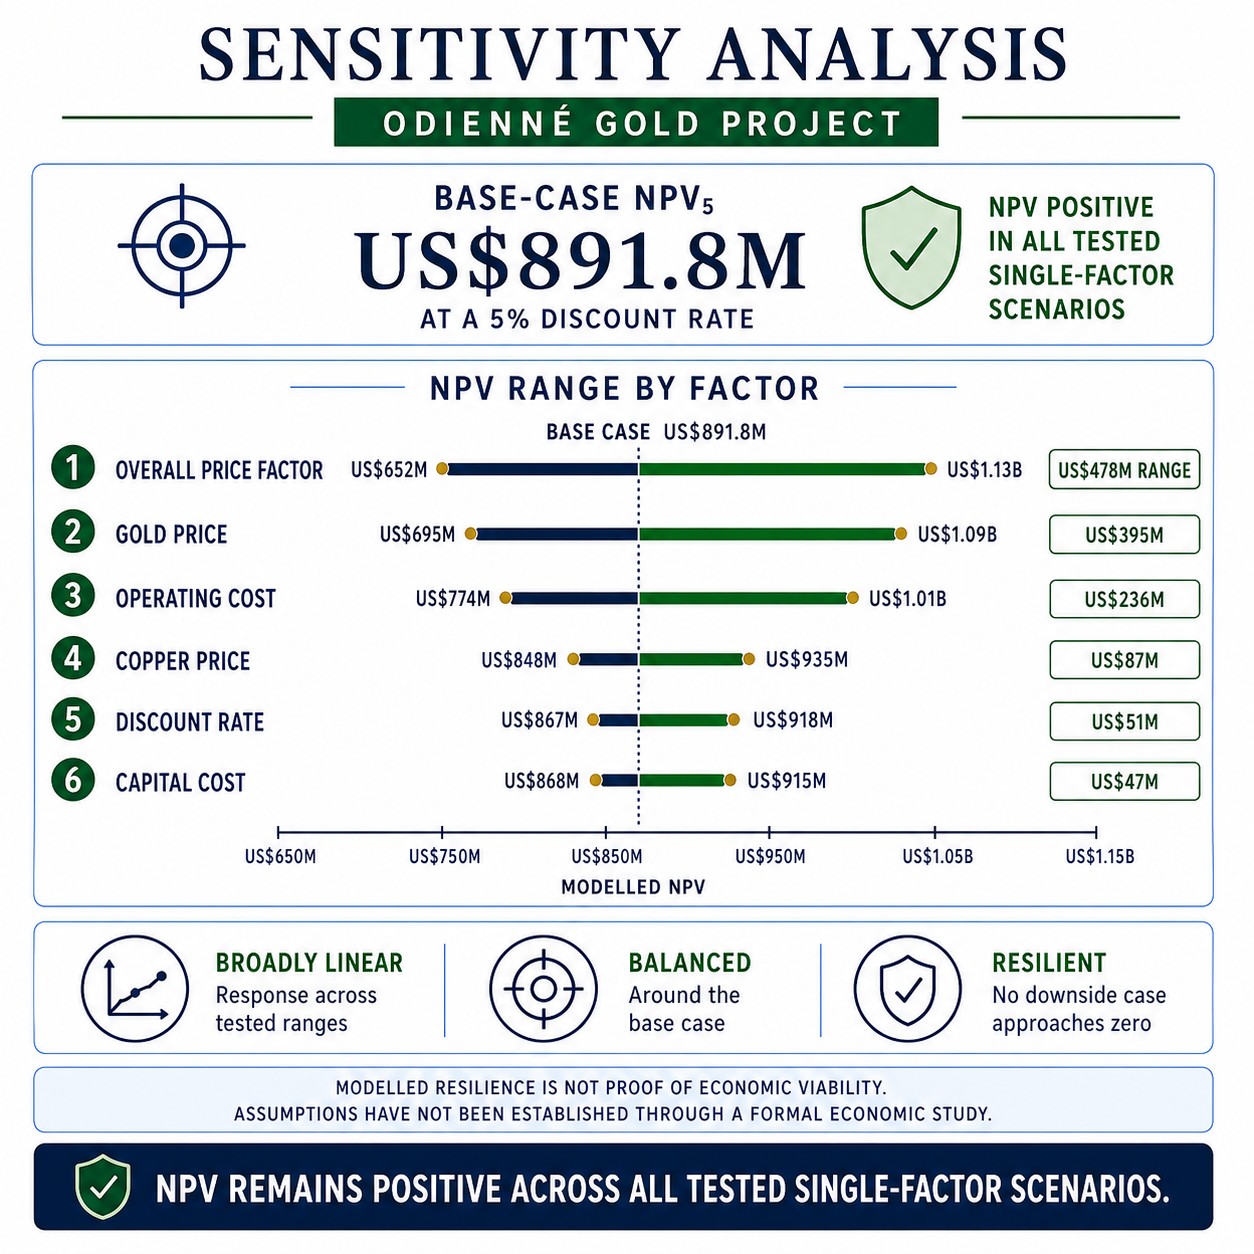
The combined commodity-price factor is the largest driver. Across the tested range, NPV moves from US$652 million to US$1.13 billion, a total range of about US$478 million.
Gold price
Gold is the dominant individual driver. The tested gold-price range moves NPV from US$695 million to US$1.09 billion. A 10% movement in gold price changes NPV by about US$197 million.
Operating cost
Operating cost is the most important controllable driver. The tested range moves NPV from US$774 million to US$1.01 billion. A 10% operating-cost movement changes NPV by about US$118 million.
Copper price
Copper price moves NPV from US$848 million to US$935 million. Copper is meaningful, but the project is not primarily dependent on copper prices.
Discount rate
The tested discount-rate range moves NPV from US$867 million to US$918 million. The relatively small effect reflects the modelled short mine life and early cash generation.
Capital cost
Capital cost produces the smallest tested NPV range, from US$868 million to US$915 million. This does not mean CAPEX accuracy is unimportant; it means moderate changes have less influence than commodity prices and operating cash flow within the selected ranges.
Sensitivity ranking, from greatest to least influence:
- Overall commodity-price factor
- Gold price
- Operating cost
- Copper price
- Discount rate
- Capital cost
Sensitivity Analysis
The base-case project NPV is US$891.8 million at a 5% discount rate. Across all single-factor scenarios shown, NPV remains positive and ranges from US$652 million to US$1.13 billion.
| Sensitivity factor | Lower-case NPV | Upper-case NPV | Total NPV range |
| Overall price factor | US$652m | US$1.13bn | US$478m |
| Gold price | US$695m | US$1.09bn | US$395m |
| Operating cost | US$774m | US$1.01bn | US$236m |
| Copper price | US$848m | US$935m | US$87m |
| Discount rate | US$867m | US$918m | US$51m |
| Capital cost | US$868m | US$915m | US$47m |
The sensitivity response is broadly linear and balanced around the base case. No single-factor downside scenario reduces NPV close to zero. This indicates modelled resilience within the tested ranges, but it does not demonstrate economic viability because the underlying assumptions have not been established through a formal economic study.
Gold price and operating cost heatmap
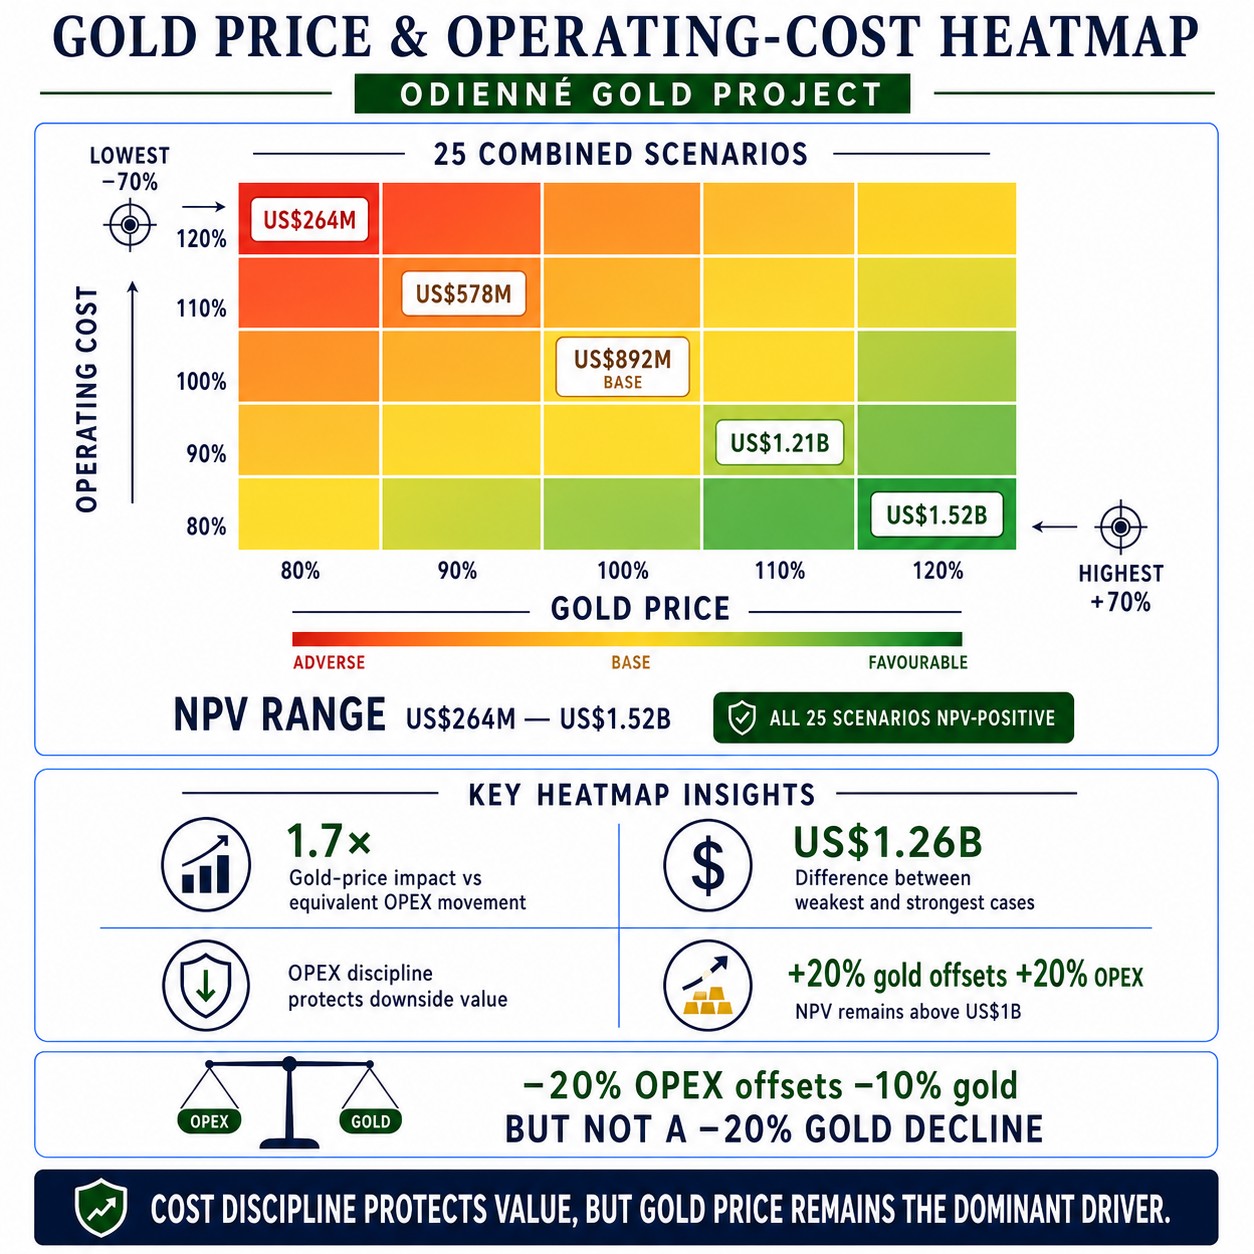
The heatmap tests the combined effect of gold-price and operating-cost movements from 80% to 120% of the base assumptions. Across the 25 scenarios, project NPV ranges from US$264 million to US$1.52 billion.
| Scenario | Project NPV | Change from base |
| Gold price -20%; operating cost +20% | US$264m | -US$628m / -70% |
| Gold price -10%; operating cost +10% | US$578m | -US$314m / -35% |
| Base case | US$892m | – |
| Gold price +10%; operating cost -10% | US$1.21bn | +US$318m / +36% |
| Gold price +20%; operating cost -20% | US$1.52bn | +US$628m / +70% |
Main heatmap insights
- Gold price has 1.7 times the NPV impact of an equivalent percentage movement in operating costs.
- All 25 tested scenarios remain NPV-positive.
- The difference between the weakest and strongest cases is US$1.26 billion.
- A 20% reduction in operating costs more than offsets a 10% fall in gold price, but does not fully offset a 20% gold-price decline.
- A 20% gold-price increase more than offsets a 20% increase in operating costs and retains NPV above US$1 billion.
- Operating-cost discipline can protect value in downside markets, although it cannot remove exposure to a severe gold-price decline.
Margin and break-even anlysis
| Metric | NI 43-101-derived case | Updated-price case |
| Net Smelter Return | US$135.02/t | US$212.35/t |
| Cash operating margin | US$73.67/t | US$150.99/t |
| Operating margin | 54.56% | 71.11% |
| Copper break-even cut-off grade | 0.70% | 0.53% |
| Copper mine-design cut-off grade | 0.84% | 0.64% |
| Recovery-adjusted CuEq | 1.57% | 1.88% |
| NSR CuEq | 1.53% | 1.85% |
The model calculates a negative copper AISC and a zero copper break-even price because gold is treated as a by-product credit. Under this methodology, gold revenue is sufficient to cover the costs allocated to copper. These results should not be interpreted as a literal negative production cost.
The increase in copper-equivalent grades between the two scenarios is economic rather than geological. Metal-equivalent grades are influenced by commodity prices, recoveries, payability and commercial terms. The underlying gold and copper grades remain unchanged.

Resource Growth and Future Value
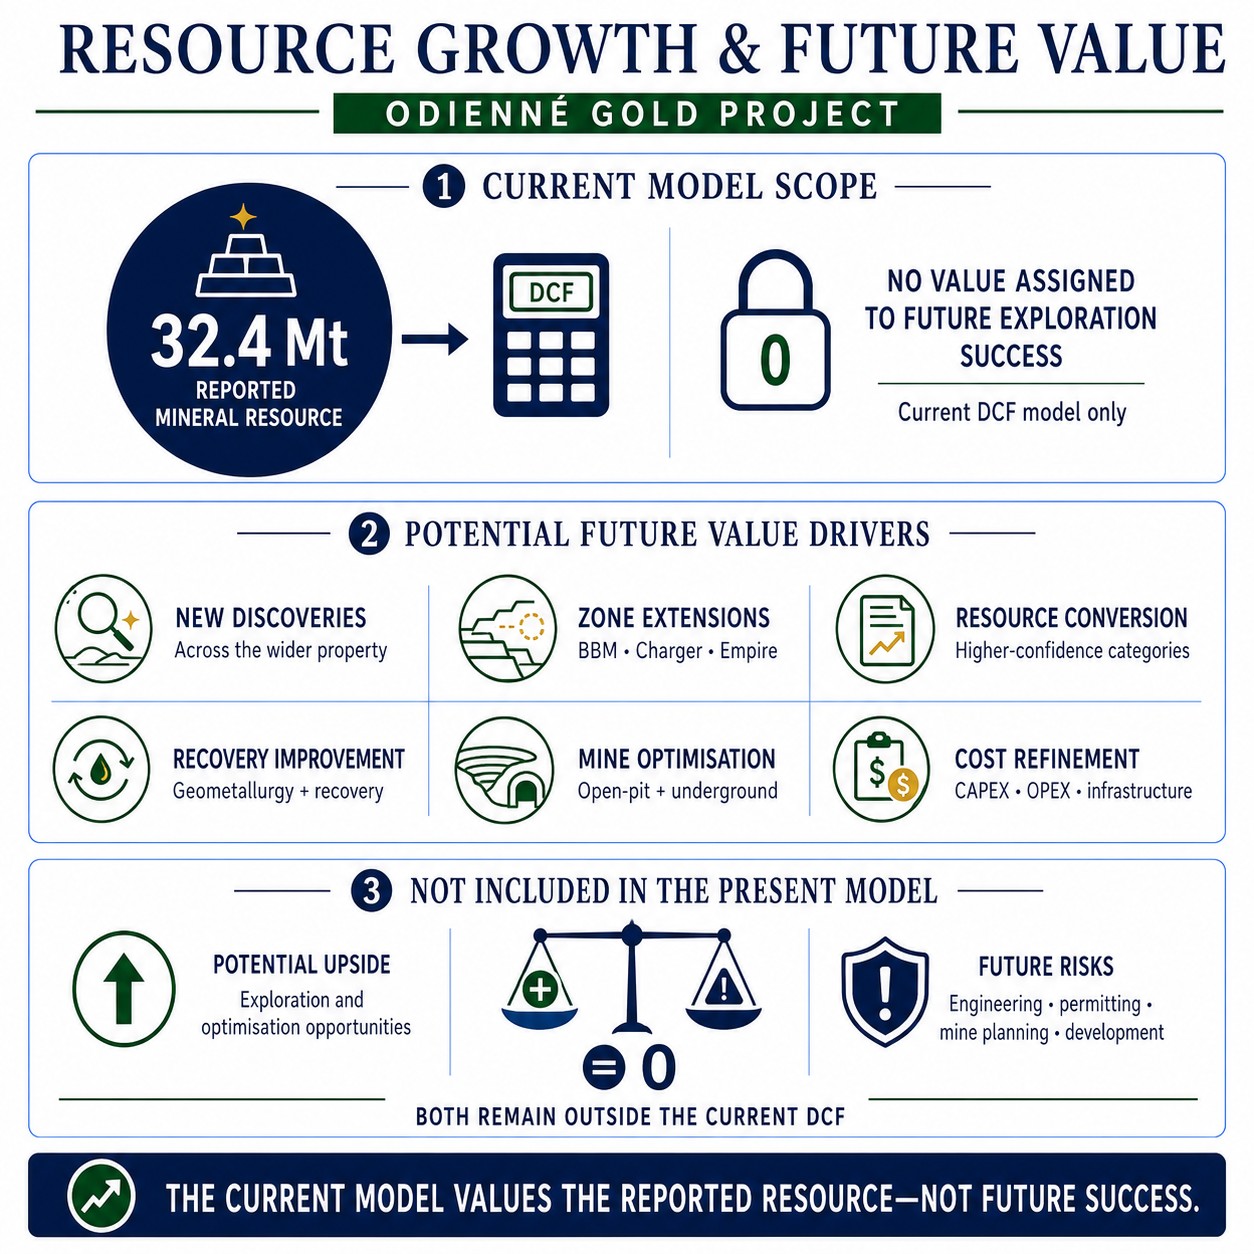
The current DCF model uses the reported 32.4 Mt Mineral Resource and assigns no value to future exploration success. The technical report identifies underexplored areas, untested targets, opportunities to extend known mineralisation and the potential to improve resource confidence through additional drilling.
Potential future value drivers include:
- Additional discoveries across the wider property
- Extensions to BBM, Charger and Empire
- Conversion of Inferred Resources to higher-confidence categories
- Improved geometallurgical and recovery assumptions
- More detailed mine planning and optimisation of open-pit and underground material
- Refinement of capital, operating-cost and infrastructure assumptions
None of these potential improvements is included in the present model. Conversely, the model also does not capture the risks that may emerge through more detailed engineering, permitting, mine planning and project development work.
Conclusion
Stormlands’ illustrative model of the Odienné Gold Project shows a gold-led project with meaningful copper revenue, strong operating leverage and substantial sensitivity to the commodity-price environment.
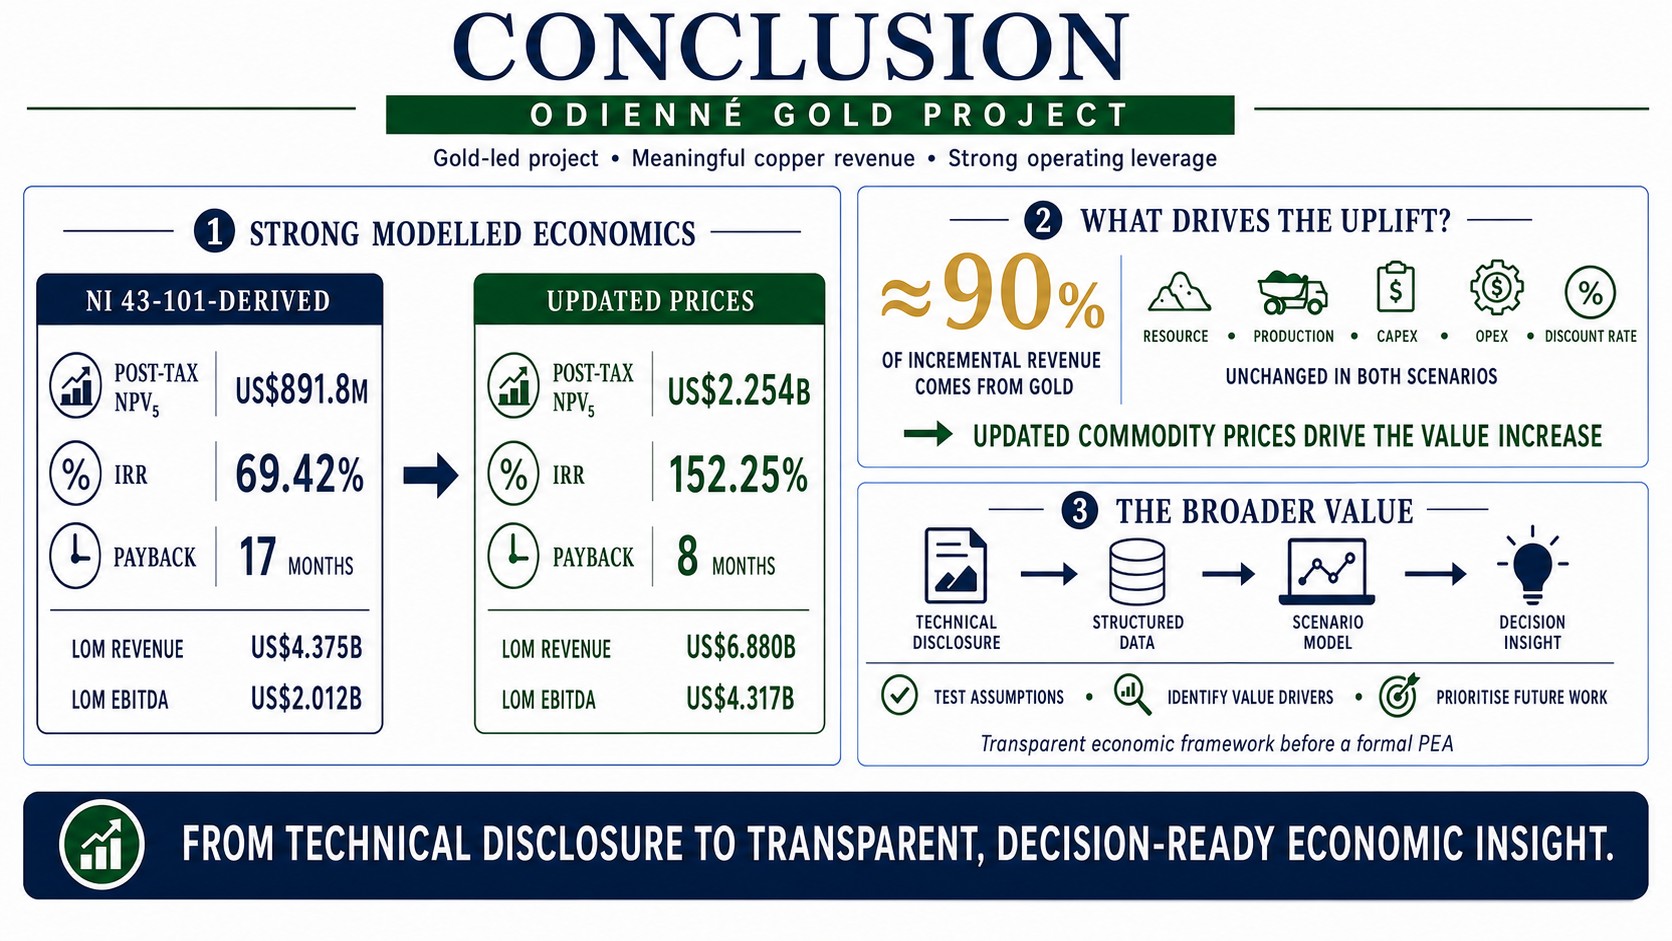
Under the NI 43-101-derived scenario, the model produces a post-tax NPV of US$891.8 million, an IRR of 69.42%, a payback period of 17 months, life-of-mine revenue of US$4.375 billion and life-of-mine EBITDA of US$2.012 billion.
Under updated commodity prices, NPV increases to US$2.254 billion, IRR rises to 152.25%, payback shortens to eight months, revenue increases to US$6.880 billion and EBITDA increases to US$4.317 billion.
The resource, production profile, capital expenditure, operating costs and discount rate remain unchanged. The increase in value is driven by updated commodity prices, with gold accounting for 90% of the incremental revenue.
The broader insight is more important than any single output. Odienné demonstrates how structured technical disclosure can be transformed into a transparent, scenario-based economic framework before a formal PEA is available. This enables project teams, investors, analysts and advisers to test assumptions, identify value drivers and focus future technical work on the factors that matter most.
About Stormlands
Stormlands Mining is an AI-first valuation and analytics platform for mining assets and critical minerals. The platform helps users turn technical disclosures into interactive valuation models in minutes, rather than days or weeks. The valuation models are accessible over multiple platforms to all users, enabling the user to interact directly with the data to facilitate scenario-planning.
The platform enables users to build discounted cash flow models at scale, test commodity price, capex, opex, tax, royalty rates, discount-rates and production scenarios, and compare opportunities and scenarios.
Stormlands is using this technology to build the Stormlands Library: a global repository of mining asset valuation models. It has moved beyond a tool for analysts building individual models and is developing a data layer for the mining industry: a structured source of valuation models and illustrative scenarios. This creates a new way for investors, corporates, professional advisers, financial-market users and public-policy stakeholders to screen assets, benchmark projects and understand the key drivers of mining asset economics.
If you are interested in accessing the models in the library, email ceo@stormlandsmining.com
Important Notice
This analysis has been prepared by Stormlands Mining using publicly available information from the NI 43-101 Technical Report together with Stormlands’ own independent modelling assumptions.
The analysis is illustrative only. It is not a Preliminary Economic Assessment, Pre-Feasibility Study, Feasibility Study, Mineral Reserve estimate or independent technical report. It has not been prepared on behalf of the project owner and has not been reviewed or approved by the project owner.
The model outputs are Stormlands-generated illustrative estimates only. They should not be interpreted as demonstrated economic viability. Future technical work, including mine planning, metallurgical testing, engineering, environmental studies, permitting, capital-cost estimation and operating-cost estimation, would be required before any formal economic conclusions could be drawn.