
Bralorne Gold Project
Based on the NI 43-101 Mineral Resource Estimate, report date June 26 2026, prepared for Talisker Resources, and independent modelling by Stormlands Mining
Stormlands Mining illustrative economic analysis based on NI 43-101 MRE
Introduction
Stormlands Mining’s independent analysis of the Bralorne Gold Project in British Columbia shows how a publicly available NI 43-101 Mineral Resource Estimate can be converted into an illustrative economic valuation model before a formal Preliminary Economic Assessment has been published.
The project is located in the historic Bridge River mining district, a well-established high-grade gold district. Historical production from the Bralorne and Pioneer mines is recorded at 7.3 Mt grading 17.7 g/t Au, equivalent to approximately 4.2 Moz of gold. The technical report also notes that Bralorne has existing mine infrastructure, including site facilities, water treatment infrastructure, underground portals, road access, communications and power-related infrastructure.
Key Highlights
Valuation is strong. Using the NI 43-101 data, the Stormlands model produces a post-tax Project Net Present Value (NPV) of US$181.8 million at a 5% discount rate. The model also shows Project IRR of 83.3%, payback of 1 year and 2 months, mine life of 5.37 years, life-of-mine revenue of US$551.9 million, life-of-mine EBITDA of US$411.6 million, and life-of-mine corporate income tax of US$99.7 million.
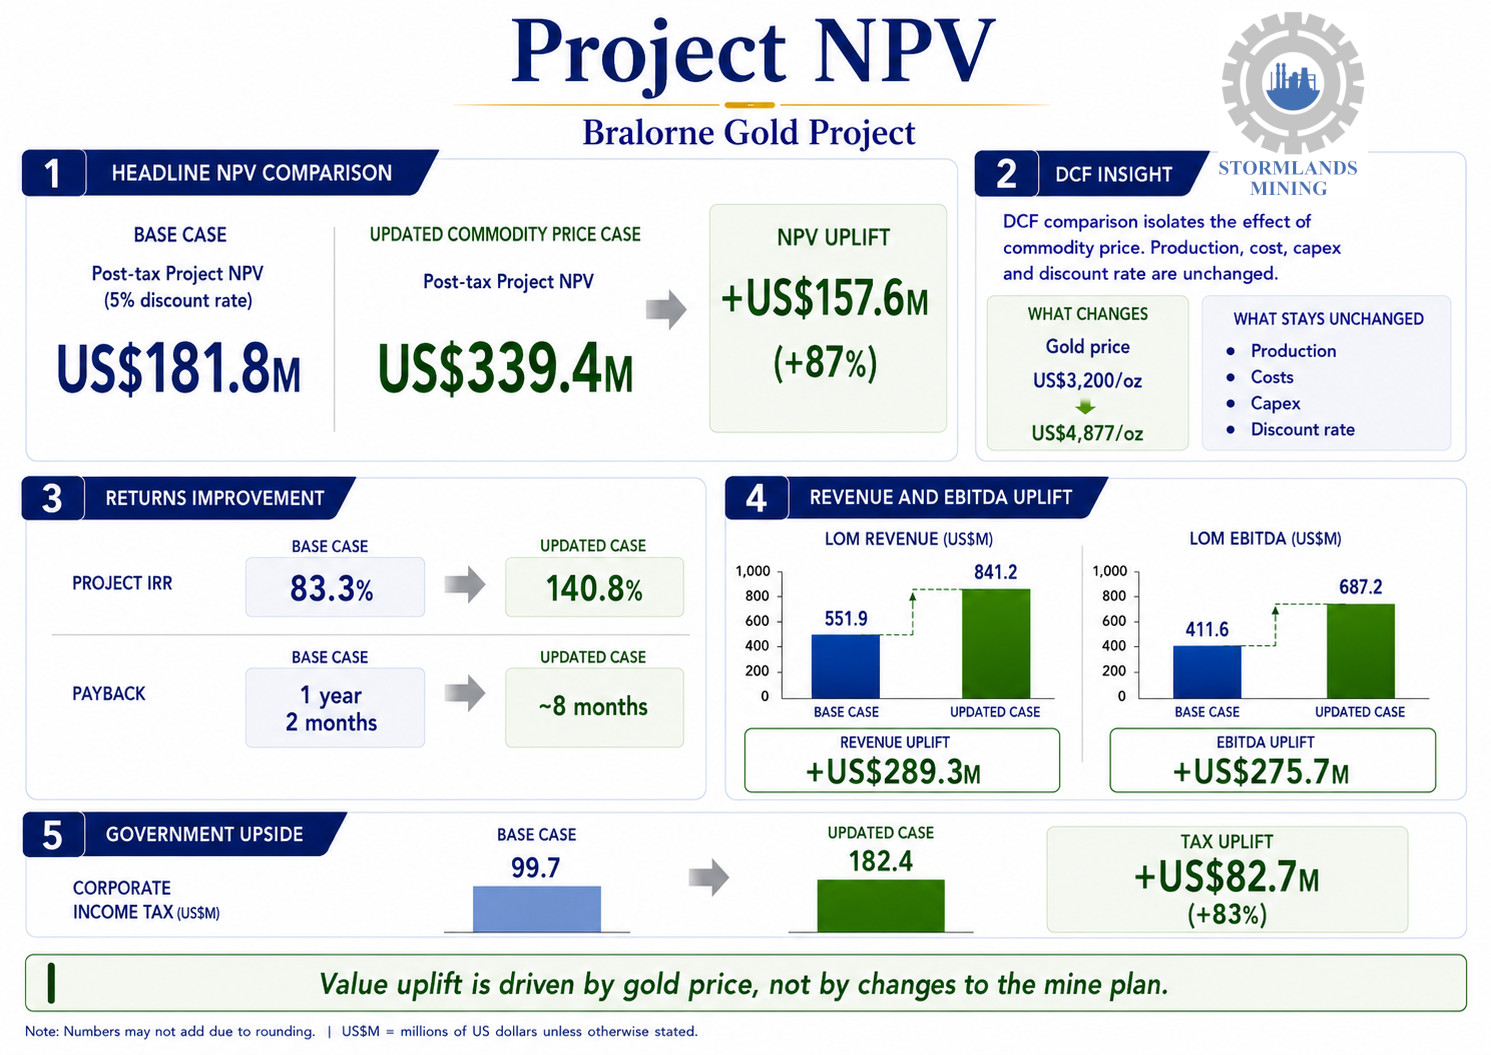
Updated commodity prices materially increase value. When the same model is updated from the gold price cited in the NI 43-101, of US$3,200/oz, to current commodity price of US$4,877/oz, post-tax project NPV increases from US$181.8 million to US$339.4 million. That is an uplift of approximately US$157.6 million, or around 87%.
Project returns improve sharply under the updated price case. The updated commodity price case increases Project IRR from 83.3% to 140.8%. Payback improves from 1 year and 2 months to approximately 8 months. Stronger gold prices do not just increase NPV. They also accelerate capital recovery and materially improve the project’s risk-reward profile.
Revenue and EBITDA uplift are substantial. Life-of-mine revenue increases from US$551.9 million to US$841.2 million. Life-of-mine EBITDA increases from US$411.6 million to US$687.2 million. The revenue uplift is approximately US$289.3 million, while the EBITDA uplift is approximately US$275.7 million. This shows that a large portion of the increased gold revenue flows through to operating profitability.
Uplift is driven purely by price. The underlying mine plan does not change. The modelled ore body size remains 720,000 tonnes. Mine output remains approximately 647,994 tonnes. Mine life remains 5.37 years. Operating cost, capital cost, sustaining capex and discount rate are unchanged. What changes is the gold price.
Upside benefits government and royalty holders. Higher gold prices increase life-of-mine corporate income tax from US$99.7 million to US$182.4 million. Commercial royalties increase from US$25.9 million to US$39.5 million. The updated commodity price scenario increases value not only for investors, but also for government and royalty holders.
Updated commodity prices
Stormlands’ model produces a post-tax Project NPV of US$181.8 million at a 5% discount rate. The updated commodity price case produces a post-tax Project NPV of US$339.4 million.
The Discounted Cash Flow (DCF) comparison between the base case model and the updated commodity prices model is particularly useful because the DCF model isolates the effect of commodity price. Production, cost, capex and discount-rate assumptions are unchanged. This allows the user to see how much value is created by updating the gold price alone.
- Gold price increases from US$3,200/oz to US$4,877/oz.
- Project NPV increases from US$181.8 million to US$339.4 million.
- Project IRR increases from 83.3% to 140.8%.
- Payback improves from 1 year and 2 months to approximately 8 months.
- Life-of-mine revenue increases from US$551.9 million to US$841.2 million.
- Life-of-mine EBITDA increases from US$411.6 million to US$687.2 million.
- Corporate income tax increases from US$99.7 million to US$182.4 million.
Price Sensitivity
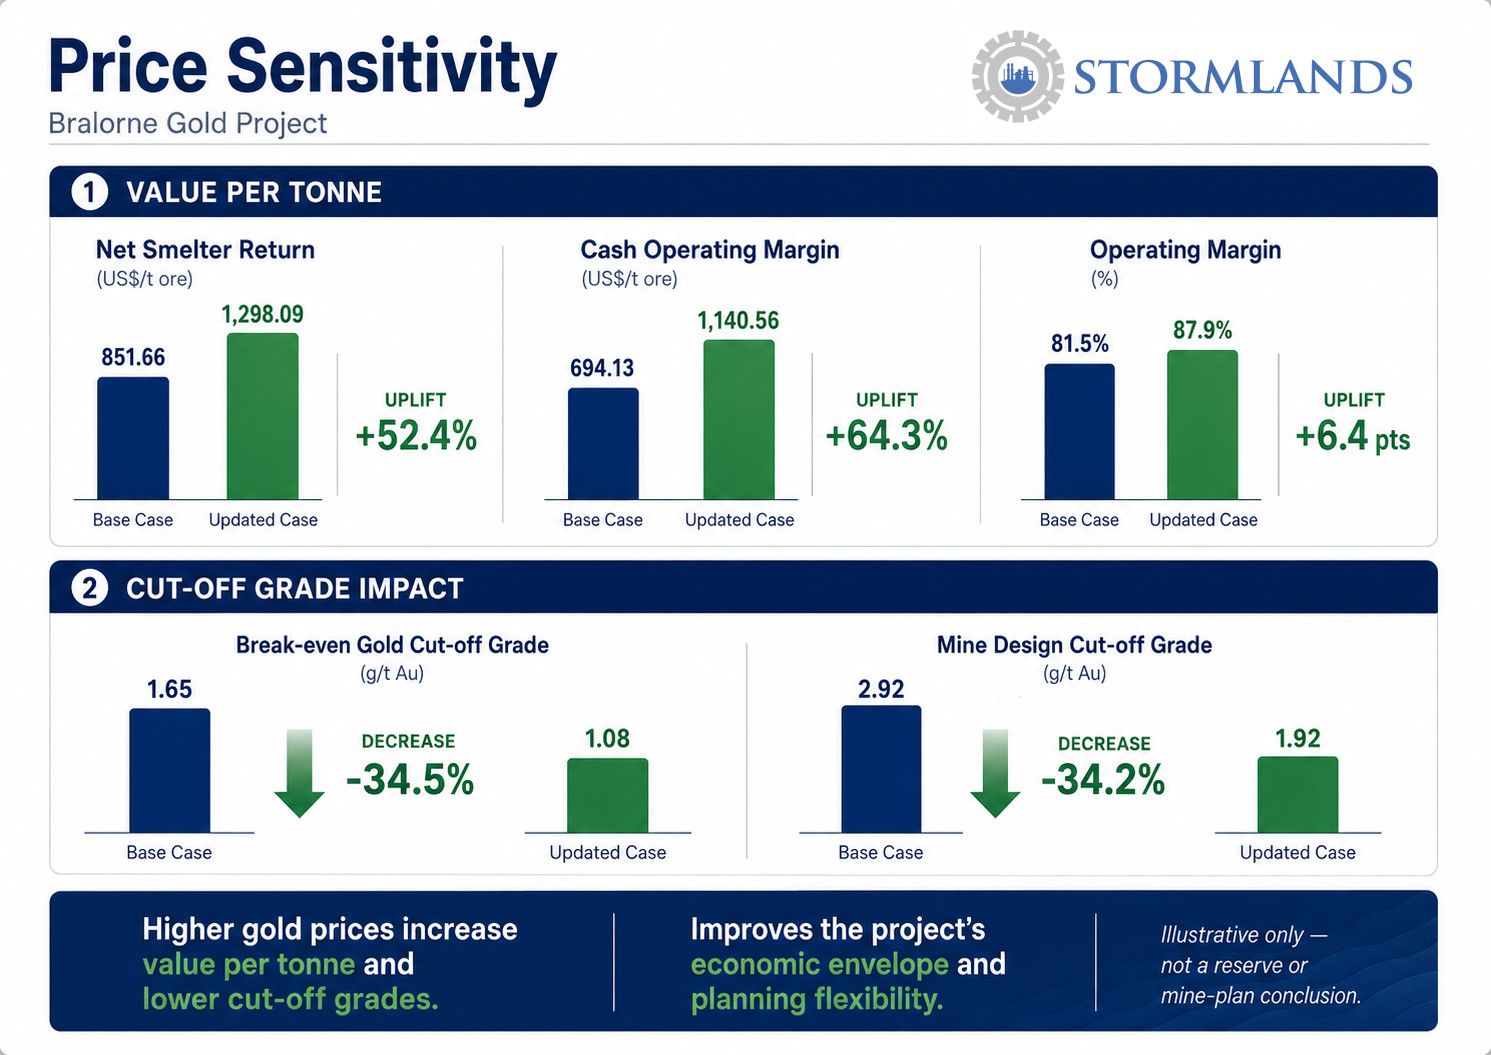
The updated commodity price case improves the value of each tonne mined. Net smelter return increases from US$851.66/t ore to US$1,298.09/t ore. Cash operating margin increases from US$694.13/t ore to US$1,140.56/t ore. Operating margin increases from 81.5% to 87.9%.
The updated price case also reduces the modelled economic cut-off profile. The break-even gold cut-off grade falls from 1.65 g/t Au to 1.08 g/t Au. The mine design cut-off grade falls from 2.92 g/t Au to 1.92 g/t Au.
This is important because stronger gold prices do not only increase headline valuation. They also improve the economic envelope of the project. In a future mine-planning context, lower cut-off grades could potentially increase planning flexibility, although that would require further technical work and should not be treated as a reserve or mine-plan conclusion.
Value Drivers
1. Gold price
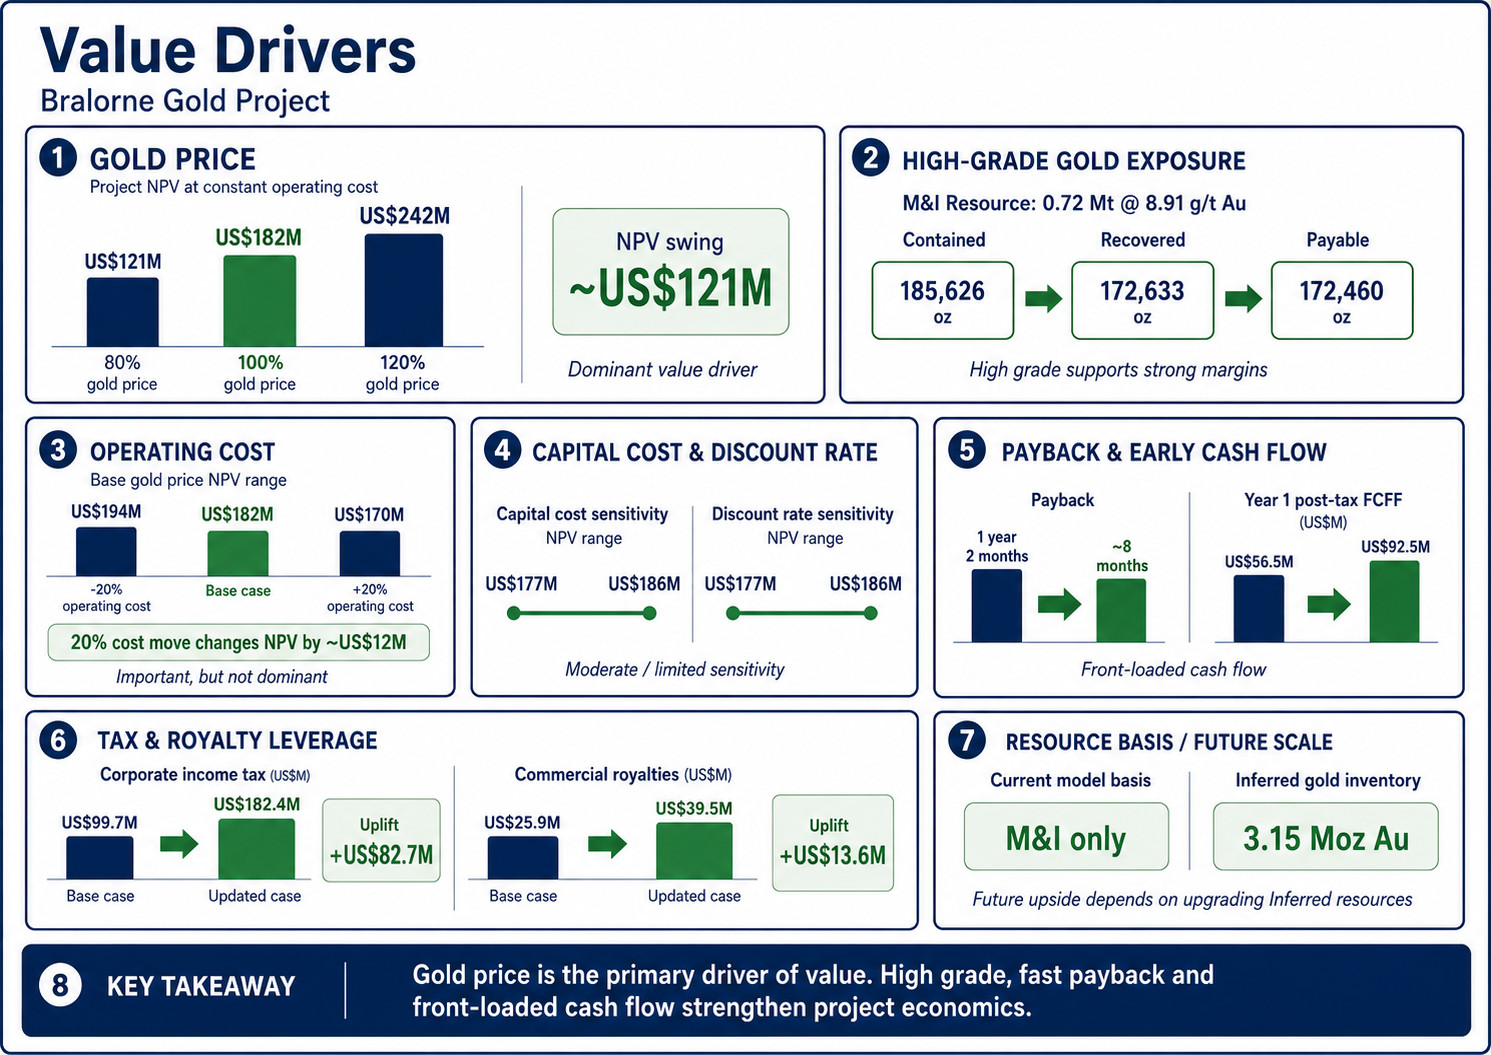
Gold price is the dominant value driver in the Bralorne model. At the base case of 100% gold price and 100% operating cost, Project NPV is approximately US$182 million. At the same operating cost level, 80% gold price produces an NPV of approximately US$121 million, while 120% gold price produces an NPV of approximately US$242 million. Across the tested range, gold price produces an NPV swing of approximately US$121 million at the base operating cost level.
This confirms that Bralorne is highly leveraged to gold price.
2. High-grade gold exposure
The model is built around a high-grade Measured and Indicated resource base of 0.72 Mt grading 8.91 g/t Au. That grade gives the project strong metal intensity per tonne. The modelled mine plan contains approximately 185,626 oz of gold, with approximately 172,633 oz recovered and 172,460 oz payable.
This high recovered and payable metal conversion is a major reason the model produces strong margins from a relatively small tonnage base.
3. Operating cost
Operating cost is important, but it is not the dominant value driver. At the base gold price level, A 20% increase in operating cost produces an NPV of approximately US$170 million, while a 20% decrease in operating cost produces an NPV of approximately US$194 million. A 20% increase in operating cost reduces NPV by only about US$12 million, while a 20% reduction in operating cost increases NPV by about US$12 million.
This indicates that Bralorne’s modelled economics are relatively resilient to operating cost movement, largely because of the high gold grade and high Net Smelter Return per tonne.
4. Capital cost
Capital cost has a moderate effect on the valuation, but it is not the main driver. The sensitivity analysis shows Project NPV moving from approximately US$177 million to US$186 million across the tested capital cost range (-20% to +20%). This suggests that capex control remains important, but the model is not primarily a capex-risk story.
5. Discount rate
Discount-rate sensitivity is relatively limited compared with gold price sensitivity. The sensitivity analysis shows NPV moving from approximately US$177 million to US$186 million across the tested discount-rate factor range. This reflects the short mine life and front-loaded cash-flow profile.
6. Payback and early cash flow
The payback profile is one of the strongest features of the model. In the base case, the project recovers initial capex in approximately 1 year and 2 months from first production. In the updated commodity price case, payback improves to approximately 8 months. The first full operating year generates approximately US$56.5 million of post-tax free cash flow in the base case and approximately US$92.5 million in the updated commodity price case.
7. Tax and royalty leverage
Higher gold prices increase the value flowing to government and royalty holders. Corporate income tax increases by approximately US$82.7 million, from US$99.7 million to US$182.4 million. Commercial royalties increase by approximately US$13.6 million, from US$25.9 million to US$39.5 million.
8. Resource conversion and future scale
The current Stormlands model is focused on the Measured and Indicated resource base. It does not rely on the much larger Inferred resource base. This is an important modelling choice. The NI 43-101 reports 3.15 Moz of Inferred gold, but Inferred resources have lower confidence and cannot be converted directly into reserves.
This creates a clear future work question: how much of the Inferred inventory can be upgraded, and how would that change the scale, mine life and economic profile of the project?
Discounted Cash Flow Model Insights
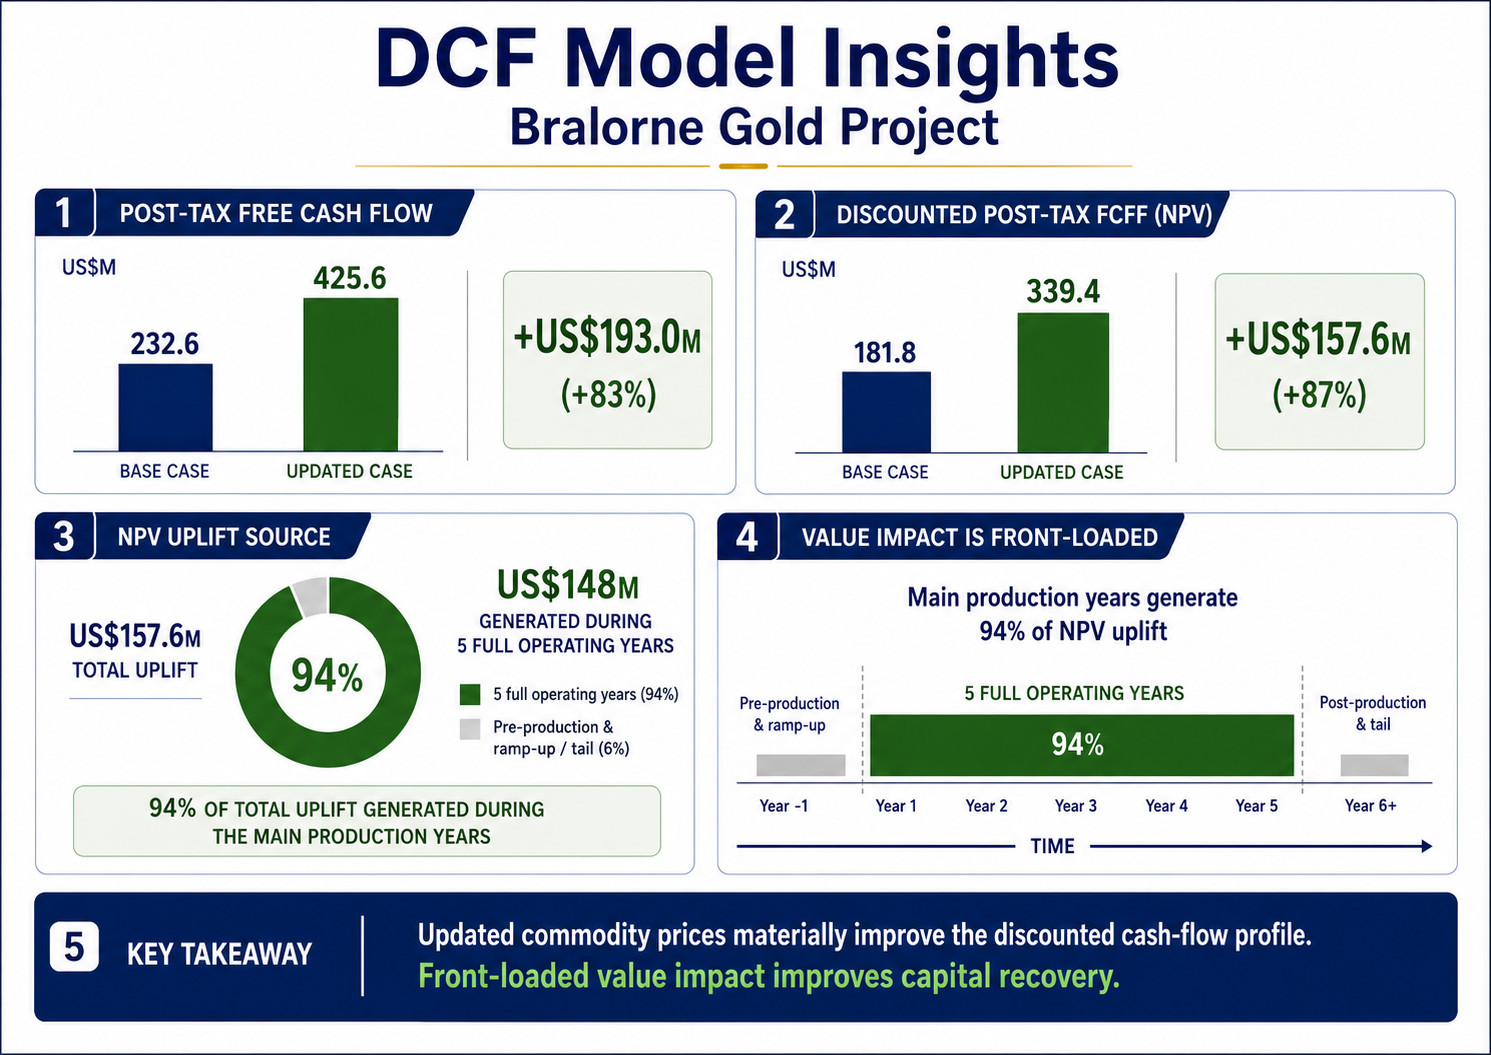
The DCF comparison shows that the updated commodity price case does not merely increase headline revenue. It materially improves the full discounted cash-flow profile.
- In the base case, the project generates post-tax free cash flow of approximately US$232.6 million.
- In the updated commodity price case, post-tax free cash flow increases to approximately US$425.6 million.
- Discounted post-tax project free cash flow, which drives NPV, increases from approximately US$181.8 million to US$339.4 million.
- The five full operating years add approximately US$148 million of the total US$157.6 million NPV uplift.
That means approximately 94% of the NPV uplift is generated during the main production years. This is important because it shows that the updated price case is not relying on distant, heavily discounted cash flows. The value impact is front-loaded and directly improves capital recovery.
Stormlands Sensitivity Analysis
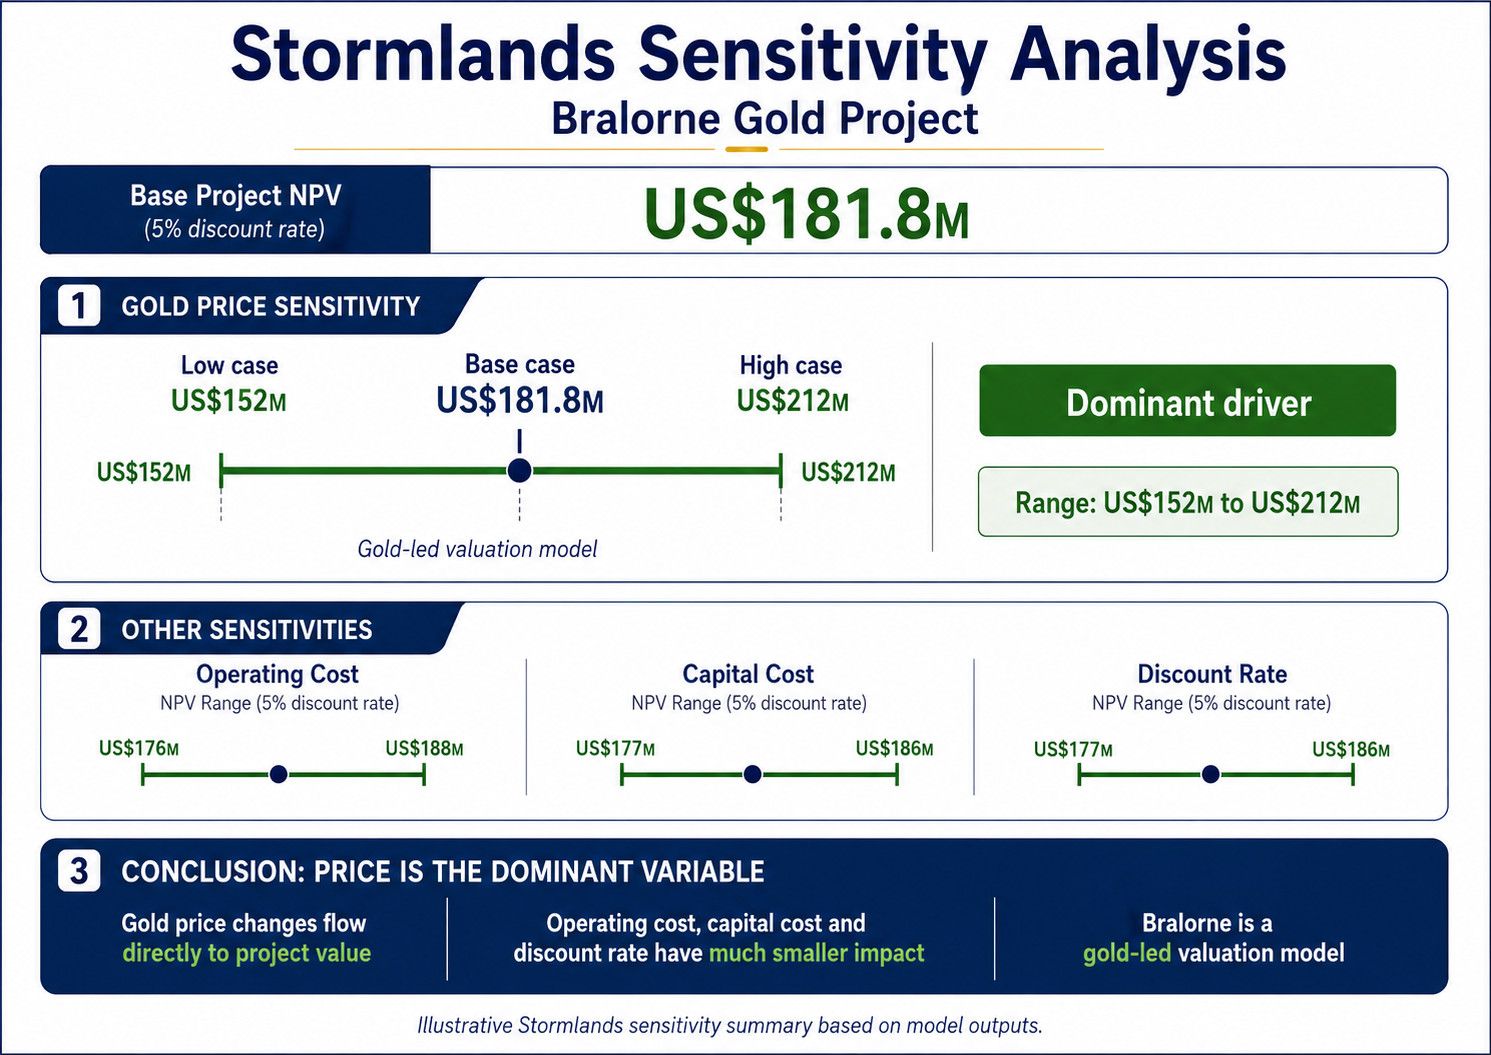
The base model sensitivity analysis shows that Bralorne’s NPV is overwhelmingly driven by gold price. At a 5% discount rate, the base Project NPV is approximately US$181.8 million. A 10% increase or decrease in discount rate produces a new NPV ranging from US$152 million to US$212 million.
By comparison, operating cost sensitivity moves NPV from approximately US$176 million to US$188 million. Capital cost sensitivity moves NPV from approximately US$177 million to US$186 million. Discount-rate sensitivity moves NPV from approximately US$177 million to US$186 million.
The conclusion is clear: price is the dominant variable. This is also why the updated commodity price case has such a large impact. Bralorne is not a polymetallic model where changes in one metal may be diluted by other revenue streams. It is a gold-led valuation model, and changes in gold price flow directly through to project value.
Conclusion
Stormlands’ illustrative model of the Bralorne Gold Project shows a high-grade, gold-led project with strong modelled economics and significant leverage to gold price.
Using the NI 43-101 data and gold price, the model produces a post-tax Project NPV of approximately US$181.8 million, Project IRR of 83.3%, and payback of 1 year and 2 months. Under the updated commodity price scenario, NPV increases to approximately US$339.4 million, IRR improves to 140.8%, and payback shortens to approximately 8 months.
The sensitivity analysis and heatmap show that Bralorne’s value is driven primarily by gold price. Operating cost, capital cost and discount rate matter, but they have a much smaller impact on valuation than the gold price assumption.
The broader insight is more important than the individual numbers. Bralorne demonstrates how Stormlands can take a Mineral Resource Estimate and create an illustrative economic model before a formal PEA exists. This gives analysts, investors and project teams a way to test scenarios, understand value drivers and identify the technical assumptions that matter most.
For development-stage mining projects, this is where dynamic modelling can add real value: not by replacing formal technical studies, but by helping decision-makers understand the economic questions that should be asked next.
About Stormlands
Stormlands Mining is an AI-first valuation and analytics platform for mining assets and critical minerals. The platform helps users turn technical disclosures into interactive valuation models in minutes, rather than days or weeks. The valuation models are accessible over multiple platforms to all users, enabling the user to interact directly with the data to facilitate scenario-planning.
The platform enables users to build discounted cash flow models at scale, test commodity price, capex, opex, tax, royalty rates, discount-rates and production scenarios, and compare opportunities and scenarios.
Stormlands is using this technology to build the Stormlands Library: a global repository of mining asset valuation models. It has moved beyond a tool for analysts building individual models and is developing a data layer for the mining industry: a structured source of valuation models and illustrative scenarios. This creates a new way for investors, corporates, professional advisers, financial-market users and public-policy stakeholders to screen assets, benchmark projects and understand the key drivers of mining asset economics.
If you are interested in accessing the models in the library, email ceo@stormlandsmining.com
Important Notice
This analysis has been prepared by Stormlands Mining using publicly available information from the NI 43-101 Technical Report together with Stormlands’ own independent modelling assumptions.
The analysis is illustrative only. It is not a Preliminary Economic Assessment, Pre-Feasibility Study, Feasibility Study, Mineral Reserve estimate or independent technical report. It has not been prepared on behalf of the project owner and has not been reviewed or approved by the project owner.
The model outputs are Stormlands-generated illustrative estimates only. They should not be interpreted as demonstrated economic viability. Future technical work, including mine planning, metallurgical testing, engineering, environmental studies, permitting, capital-cost estimation and operating-cost estimation, would be required before any formal economic conclusions could be drawn.