
Sandman Gold Project, Humboldt County, Nevada, USA
The analysis of the Sandman Gold Project, Humboldt County, Nevada, USA, is based on Stormlands Mining’s independent modelling using publicly available technical information, including the NI 43-101 Preliminary Economic Assessment with an effective date of 5 January 2026.
Introduction
The Sandman Gold Project is a gold-silver development project located in Humboldt County, Nevada, approximately 24 km northwest of Winnemucca and approximately 23 km south of the historic Sleeper Mine.
The project is owned by Borealis Mining Company Limited through Sandman Resources Inc. Borealis acquired the project through the acquisition of Gold Bull Resources Corp. in March 2025. The Sandman technical report is a NI 43-101 Preliminary Economic Assessment with an effective date of 5 January 2026.
Sandman comprises four main gold deposits: North Hill, Silica Ridge, Southeast Pediment and Abel Knoll. The deposits are interpreted as low-sulphidation epithermal gold-silver systems. The project has been assessed as a potential open-pit, heap-leach operation, with contract mining, on-site crushing, heap leaching and loaded carbon transported off site for final gold doré recovery.
Stormlands rebuilt a dynamic discounted cash flow model for Sandman using the disclosed mine plan, production schedule and economic assumptions. The model includes mine production, ore production, gold doré production, gold and silver revenue, operating costs, capital costs, sustaining capital, commercial royalties, government royalties, corporate income tax, post-tax free cash flow, NPV, IRR, payback, sensitivity analysis and price-operating cost heatmaps.
Two scenarios were modelled and compared:
- A base case model extracted from the NI 43-101 technical report assumptions, using gold and silver price assumptions of US$2,600/oz gold and US$20/oz silver.
- An updated commodity price case using updated price assumptions of US$4,877.40/oz gold and US$74.92/oz silver.
All other core assumptions were held constant between the two cases. Mine life, ore processed, gold grade, silver grade, recovered metal, operating cost, capital cost, sustaining capital and fiscal assumptions remain unchanged. The comparison therefore isolates the impact of updated commodity prices on the project’s valuation.
Key Highlights
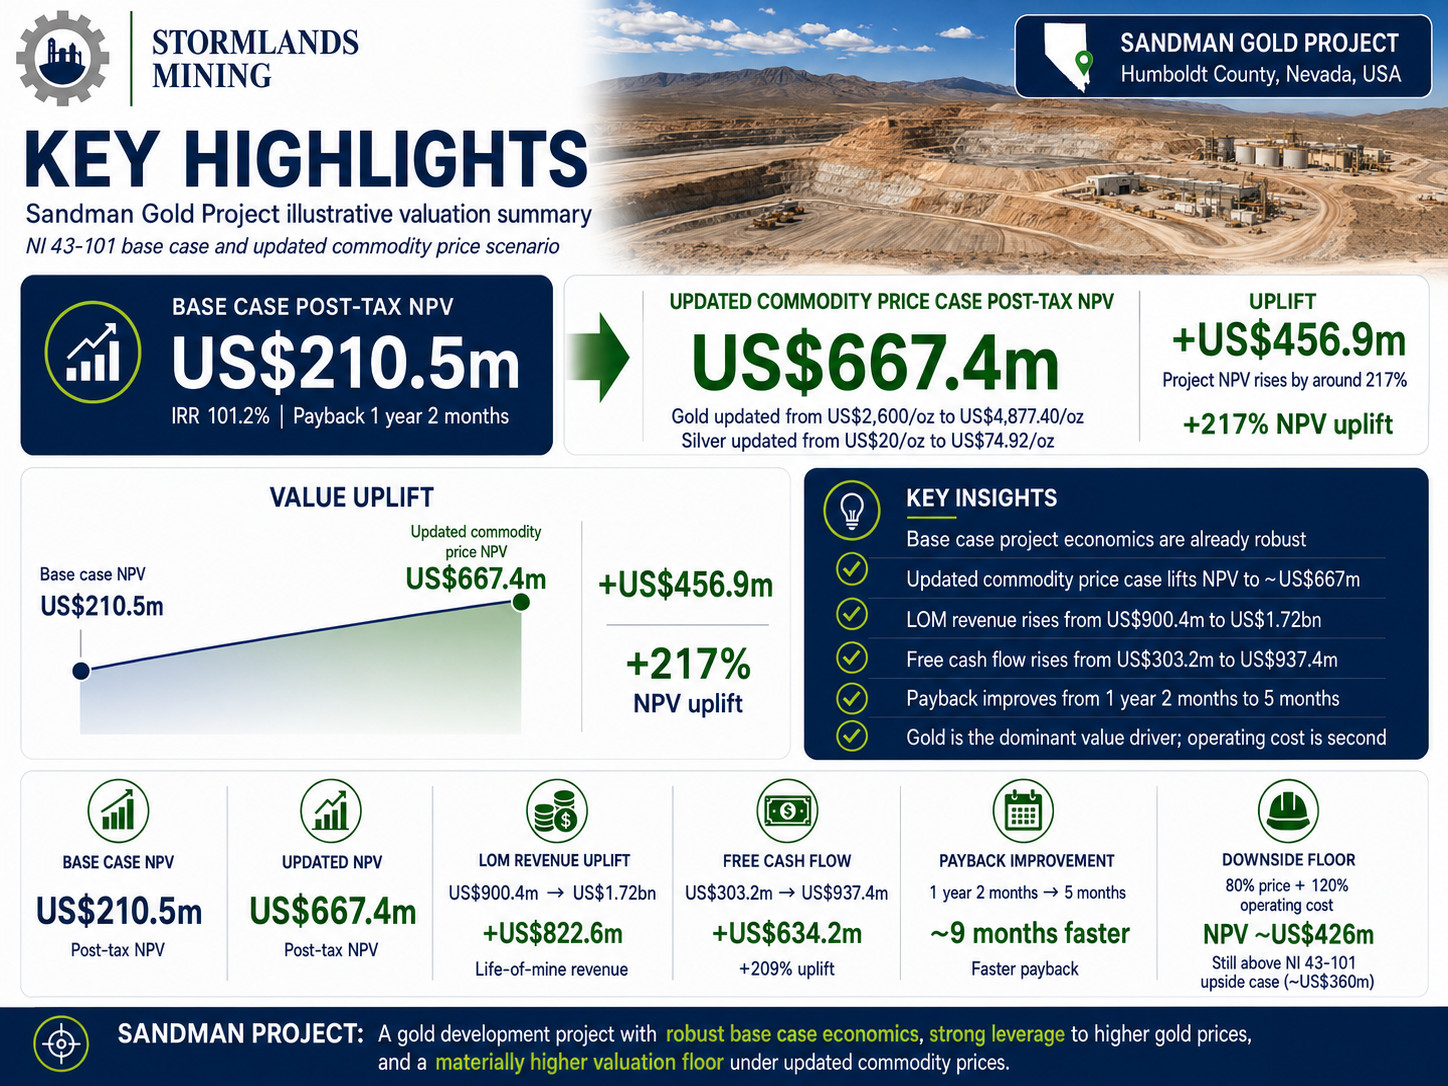
The Sandman base case is already robust. Using the NI 43-101 extracted assumptions, the Stormlands model generates a post-tax project NPV of approximately US$210.5 million at a 6% discount rate, with a project IRR of 101.2% and payback of approximately 1 year and 2 months.
The updated commodity price case materially re-rates the project. Updating the same model to US$4,877.40/oz gold and US$74.92/oz silver increases post-tax project NPV to approximately US$667.4 million.
The NPV uplift is more than 3x. Project NPV increases by approximately US$456.9 million, from US$210.5 million to US$667.4 million. This represents an uplift of approximately 217%.
Revenue almost doubles. Life-of-mine revenue increases from approximately US$900.4 million in the NI 43-101 extracted case to approximately US$1.72 billion in the updated commodity price case, an uplift of approximately US$822.6 million, or 91%.
Free cash flow increases much faster than revenue. Post-tax project free cash flow increases from approximately US$303.2 million to approximately US$937.4 million, an uplift of approximately US$634.2 million, or 209%.
The project captures a high share of incremental revenue. Approximately 77% of the additional revenue in the updated commodity price case flows through to post-tax project free cash flow after royalties and corporate tax.
Operating margins expand materially. Cash operating margin increases from approximately US$23.86/t ore to approximately US$66.22/t ore. Operating margin percentage increases from approximately 51.5% to 74.6%.
Payback improves sharply. Payback improves from approximately 1 year and 2 months in the NI 43-101 extracted case to approximately 5 months in the updated commodity price case.
Gold is the dominant revenue driver. Gold accounts for approximately 98% of revenue in the NI 43-101 extracted case and approximately 96% of revenue in the updated commodity price case. Silver provides useful by-product support, but Sandman remains fundamentally a gold-driven project.
Silver improves by-product economics but does not drive the investment case. Silver revenue increases from approximately US$16.5 million to approximately US$61.8 million, helping reduce AISC from approximately US$1,472.70/oz gold to approximately US$1,397.76/oz gold.
Government revenues increase materially. Government royalties and corporate income tax increase from approximately US$91.4 million in the NI 43-101 extracted case to approximately US$269.9 million in the updated commodity price case
The updated case has a much higher valuation floor. In the heatmap downside case of 80% price and 120% operating cost, the updated commodity price model still generates an NPV of approximately US$426 million, which is higher than the most favourable NI 43-101 heatmap case of approximately US$360 million.
Stormlands converts static disclosure into a dynamic valuation tool. The Sandman case study demonstrates how a public technical report can be converted into a scenario-ready model, updated for commodity prices, tested for sensitivities and compared across cases.
Project context
The Sandman Gold Project is located in a well-established Nevada mining jurisdiction. The project lies near Winnemucca, which provides access to regional mining services, infrastructure and labour. The technical report describes the project as comprising approximately 112 km² of consolidated checkerboard lands, including unpatented lode mining claims and private land holdings.
The 2026 NI 43-101 report presents Sandman as a Preliminary Economic Assessment. The economic analysis is preliminary in nature and is based on Indicated and Inferred Mineral Resources. No Mineral Reserves have been declared.
The reported Mineral Resource Estimate includes:
- Indicated Mineral Resources: approximately 55 million tonnes at 0.73 g/t gold, containing approximately 433,000 oz gold.
- Inferred Mineral Resources: approximately 25 million tonnes at 0.58 g/t gold, containing approximately 60,800 oz gold.
The Stormlands model reflects the mine plan used in the economic analysis. The model assumes life-of-mine ore processing of approximately 19.419 million tonnes, with an average gold grade of 0.77 g/t and an average silver grade of 3.84 g/t.
The modelled production profile contains approximately:
- 455,502 oz contained gold
- 341,627 oz recovered gold
- 341,285 oz payable gold
- 38 million oz contained silver
- 833,521 oz recovered silver
- 825,186 oz payable silver
This implies an approximate gold recovery of 75% and silver recovery of approximately 35% in the economic model.
Base case model
The Stormlands base case model reflects the NI 43-101 extracted economic assumptions for Sandman.
The base case assumes:
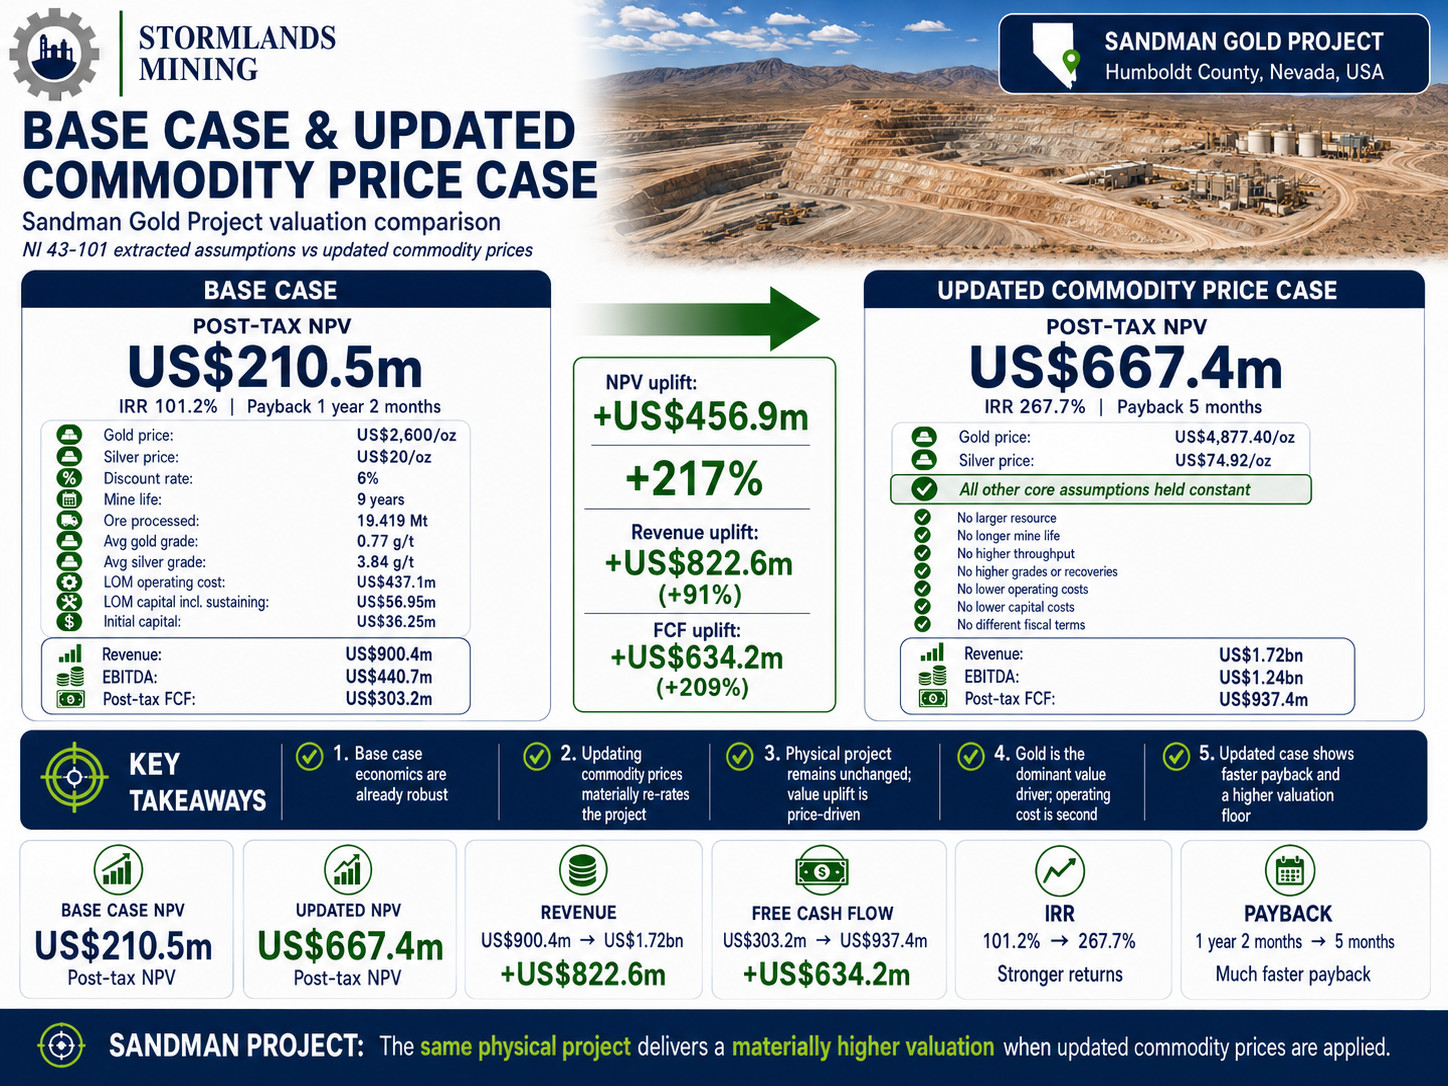
- Gold price: US$2,600/oz
- Silver price: US$20/oz
- Discount rate: 6%
- Mine life: 9 years
- Ore processed: 419 million tonnes
- Average gold grade: 77 g/t
- Average silver grade: 84 g/t
- Life-of-mine operating cost: US$437.1 million
- Life-of-mine capital cost including sustaining capital: US$56.95 million
- Initial capital: US$36.25 million
Under these assumptions, Sandman generates life-of-mine revenue of approximately US$900.4 million.
Life-of-mine EBITDA is approximately US$440.7 million, and post-tax project free cash flow is approximately US$303.2 million.
The resulting post-tax project NPV at a 6% discount rate is approximately US$210.5 million, with a project IRR of approximately 101.2%. Payback is approximately 1 year and 2 months.
This base case provides the starting point for scenario analysis. It reflects the value generated using the technical report price assumptions and allows the model to be updated as commodity prices, costs or other assumptions change.
Updated commodity price case
Stormlands then updated the Sandman model using updated commodity price assumptions of:
- Gold price: US$4,877.40/oz
- Silver price: US$74.92/oz
All other core assumptions were held constant. The updated model therefore does not assume:
- A larger resource
- A longer mine life
- Higher ore throughput
- Higher grades
- Better recoveries
- Lower operating costs
- Lower capital costs
- Different fiscal terms
This is important because the comparison isolates commodity price impact. The physical project remains the same, but the valuation context changes materially.
Under the updated commodity price case, life-of-mine revenue increases from approximately US$900.4 million to approximately US$1.72 billion. This represents an increase of approximately US$822.6 million, or 91%.
The impact on profitability is larger than the impact on revenue. Life-of-mine EBITDA increases from approximately US$440.7 million to approximately US$1.24 billion. Post-tax project free cash flow increases from approximately US$303.2 million to approximately US$937.4 million.
Project NPV increases from approximately US$210.5 million in the NI 43-101 extracted case to approximately US$667.4 million in the updated commodity price case. This is an uplift of approximately US$456.9 million, or 217%.
Project IRR increases from approximately 101.2% to approximately 267.7%, while payback improves from approximately 1 year and 2 months to approximately 5 months.
Revenue report insights
The revenue report confirms that Sandman is overwhelmingly a gold revenue model, with silver acting as a secondary by-product contributor.
In the NI 43-101 extracted case, life-of-mine revenue is approximately US$900.4 million. Of this, gold revenue contributes approximately US$883.9 million, while silver revenue contributes approximately US$16.5 million.
This means gold accounts for approximately 98.2% of total revenue in the base case.
In the updated commodity price case, life-of-mine revenue increases to approximately US$1.72 billion. Gold revenue increases to approximately US$1.66 billion, while silver revenue increases to approximately US$61.8 million.
Gold therefore still accounts for approximately 96.4% of total revenue in the updated commodity price case.
This confirms that Sandman remains primarily a gold price exposure. The increase in silver price helps improve by-product economics, but the project’s valuation is driven principally by gold.
The revenue report also shows that the payable metal profile is unchanged between the two scenarios. The updated commodity price case does not create additional ounces. It reprices the same payable production at higher gold and silver prices.
This is the central commercial point: the physical project is unchanged, but its valuation changes materially when the commodity price deck is updated.
Contained metal insights
The contained-metal report confirms that the model is built on the same physical metal base in both scenarios.
The model includes approximately 455,502 oz contained gold, of which approximately 341,627 oz are recovered and approximately 341,285 oz are payable.
For silver, the model includes approximately 2.38 million oz contained silver, of which approximately 833,521 oz are recovered and approximately 825,186 oz are payable.
The contained-metal report is important because it confirms that the updated commodity price case is not dependent on changing the production profile. It is not assuming additional drilling success, increased throughput, higher grade, better recovery or mine-life extension.
The same contained and payable metal profile generates a very different valuation when updated commodity prices are applied.
Margin and cash flow expansion
The updated commodity price case materially improves Sandman’s margin structure.
Net smelter return increases from approximately US$46.37/t ore in the NI 43-101 extracted case to approximately US$88.73/t ore in the updated commodity price case.
Operating cost remains unchanged at approximately US$22.51/t ore.
As a result, cash operating margin increases from approximately US$23.86/t ore to approximately US$66.22/t ore.
This is one of the clearest measures of the project’s operating leverage. The cost base is unchanged, but each tonne of ore generates materially higher margin under the updated commodity price deck.
Operating margin percentage increases from approximately 51.5% to approximately 74.6%.
Life-of-mine EBITDA increases from approximately US$440.7 million to approximately US$1.24 billion. This represents an increase of approximately US$802.8 million, or 182%.
Post-tax project free cash flow increases from approximately US$303.2 million to approximately US$937.4 million. This represents an increase of approximately US$634.2 million, or 209%.
The updated commodity price case therefore does not simply increase revenue. It transforms the project’s cash-flow profile.
DCF model insights
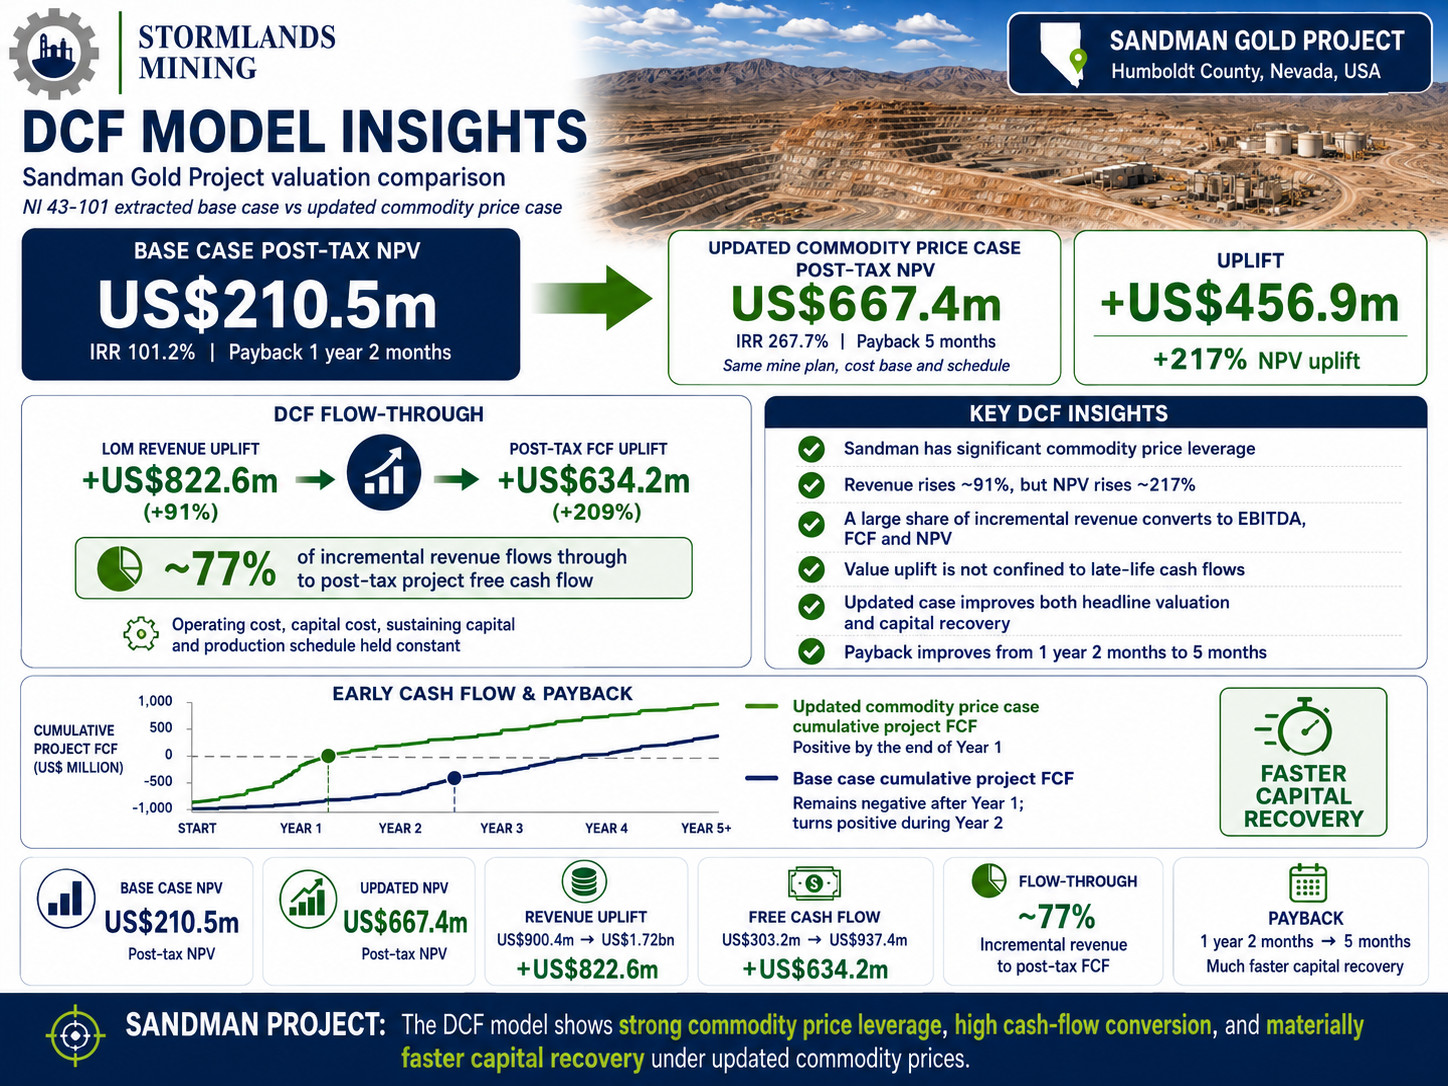
The DCF model comparison shows that Sandman has significant commodity price leverage.
Revenue increases by approximately 91%, but NPV increases by approximately 217%. This occurs because operating cost, capital cost, sustaining capital and the production schedule are unchanged. A large portion of incremental revenue flows through to EBITDA, taxable income, post-tax free cash flow and NPV.
The updated commodity price case adds approximately US$822.6 million of additional life-of-mine revenue. Of this increase, approximately US$634.2 million becomes additional post-tax project free cash flow.
This means approximately 77% of incremental revenue flows through to post-tax project free cash flow after commercial royalties, government royalties and corporate income tax.
The DCF model also shows that the valuation uplift is not confined to distant, late-life cash flows. A significant portion of the value uplift is generated early in the mine life.
In the NI 43-101 extracted case, cumulative project free cash flow remains negative after the first operating year and turns positive during the second operating year. In the updated commodity price case, cumulative project free cash flow is positive by the end of the first producing year.
This explains the improvement in payback from approximately 1 year and 2 months to approximately 5 months.
The updated case therefore improves both headline valuation and capital recovery.
Sensitivity Analysis
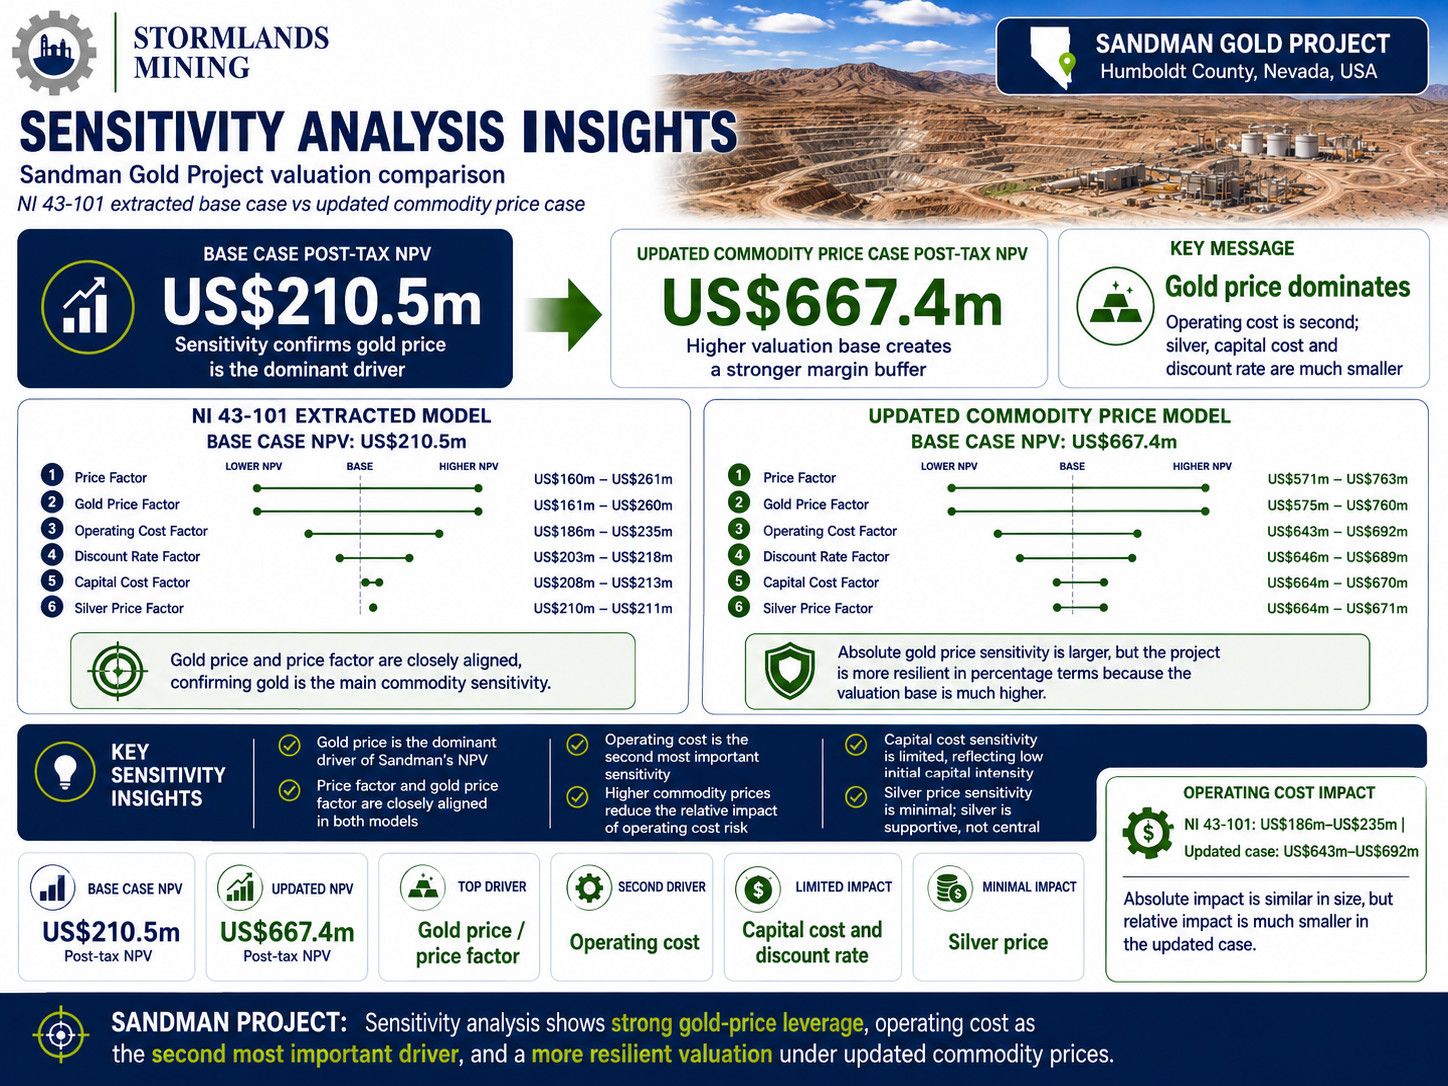
The sensitivity analysis confirms that gold price is the dominant driver of Sandman’s NPV.
In the NI 43-101 extracted model, the project NPV base case is approximately US$210.5 million. The price factor sensitivity range is approximately US$160 million to US$261 million, while the gold price factor sensitivity range is approximately US$161 million to US$260 million.
The close alignment between the price factor and gold price factor confirms that gold price drives the project’s commodity sensitivity.
In the updated commodity price model, the project NPV base case is approximately US$667.4 million. The price factor sensitivity range is approximately US$571 million to US$763 million, while the gold price factor sensitivity range is approximately US$575 million to US$760 million.
The absolute gold price sensitivity is larger in the updated case because the valuation base is larger. However, the project also becomes more resilient in percentage terms because the higher price deck creates a larger margin buffer.
Operating cost is the second most important sensitivity.
In the NI 43-101 extracted model, operating cost sensitivity ranges from approximately US$186 million to US$235 million. In the updated commodity price model, operating cost sensitivity ranges from approximately US$643 million to US$692 million.
The absolute operating cost impact is broadly similar in both models because the cost base is unchanged. However, the relative impact is much smaller in the updated commodity price case.
This is an important insight. Higher commodity prices do not remove operating cost risk, but they materially reduce its relative impact on project valuation.
Discount rate, capital cost and silver price have much smaller effects on NPV.
Capital cost sensitivity is particularly limited. In the NI 43-101 extracted model, capital cost sensitivity ranges from approximately US$208 million to US$213 million. In the updated commodity price model, it ranges from approximately US$664 million to US$670 million.
This reflects Sandman’s low initial capital intensity relative to its cash-flow potential.
Silver price sensitivity is also limited. In the updated commodity price case, silver price sensitivity only moves NPV from approximately US$664 million to US$671 million. This reinforces the conclusion that silver is a useful by-product but not the main value driver.
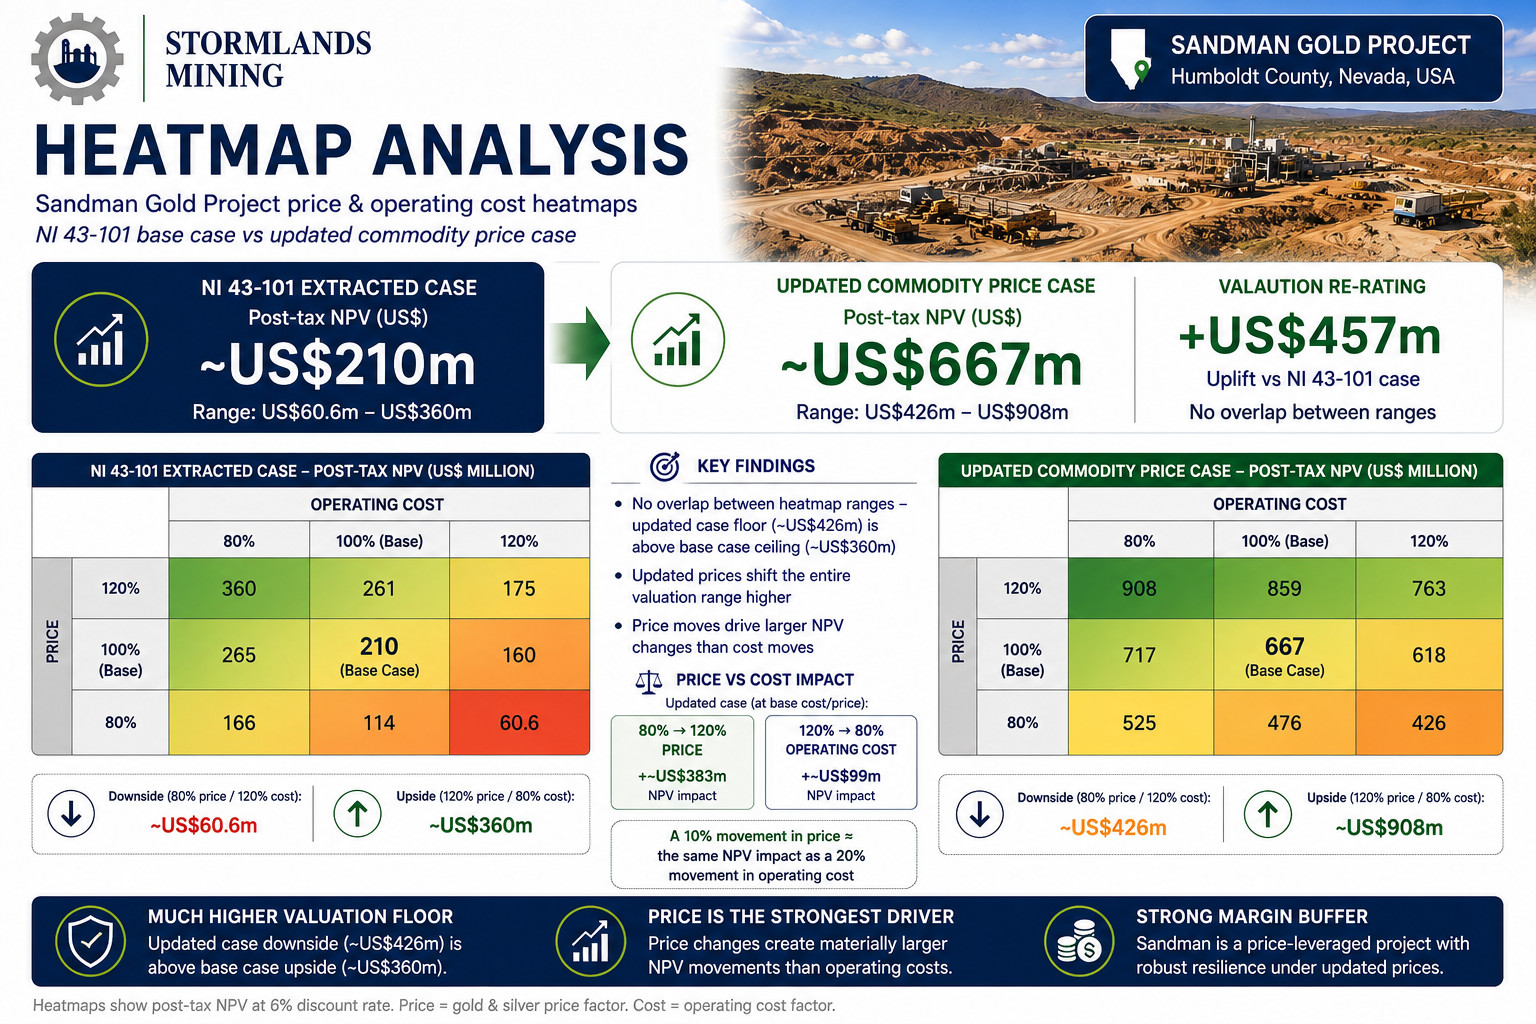
Heatmap Analysis
The price and operating cost heatmaps show the combined impact of commodity price movement and operating cost variation.
In the NI 43-101 extracted model, the base case NPV is approximately US$210 million. Across the heatmap, NPV ranges from approximately US$60.6 million in the downside case of 80% price and 120% operating cost to approximately US$360 million in the upside case of 120% price and 80% operating cost.
In the updated commodity price model, the base case NPV is approximately US$667 million. Across the heatmap, NPV ranges from approximately US$426 million in the downside case of 80% price and 120% operating cost to approximately US$908 million in the upside case of 120% price and 80% operating cost.
This is one of the strongest findings in the Sandman analysis.
The lowest NPV scenario in the updated commodity price heatmap is approximately US$426 million. This is higher than the highest NPV scenario in the NI 43-101 extracted heatmap, which is approximately US$360 million.
In other words, there is no overlap between the NI 43-101 heatmap valuation range and the updated commodity price heatmap valuation range.
The updated commodity price case does not simply improve the base case. It shifts the entire valuation range upward.
The heatmap also shows that price is more powerful than operating cost.
In the updated commodity price model, moving from 80% price to 120% price at base operating cost increases NPV from approximately US$476 million to approximately US$859 million, a gain of approximately US$383 million.
By contrast, moving from 120% operating cost to 80% operating cost at base price increases NPV from approximately US$618 million to approximately US$717 million, a gain of approximately US$99 million.
This means that in the updated model, a 10% movement in price has approximately the same NPV impact as a 20% movement in operating cost.
The heatmap confirms that Sandman is a price-leveraged project with a relatively strong margin buffer under the updated commodity price case.
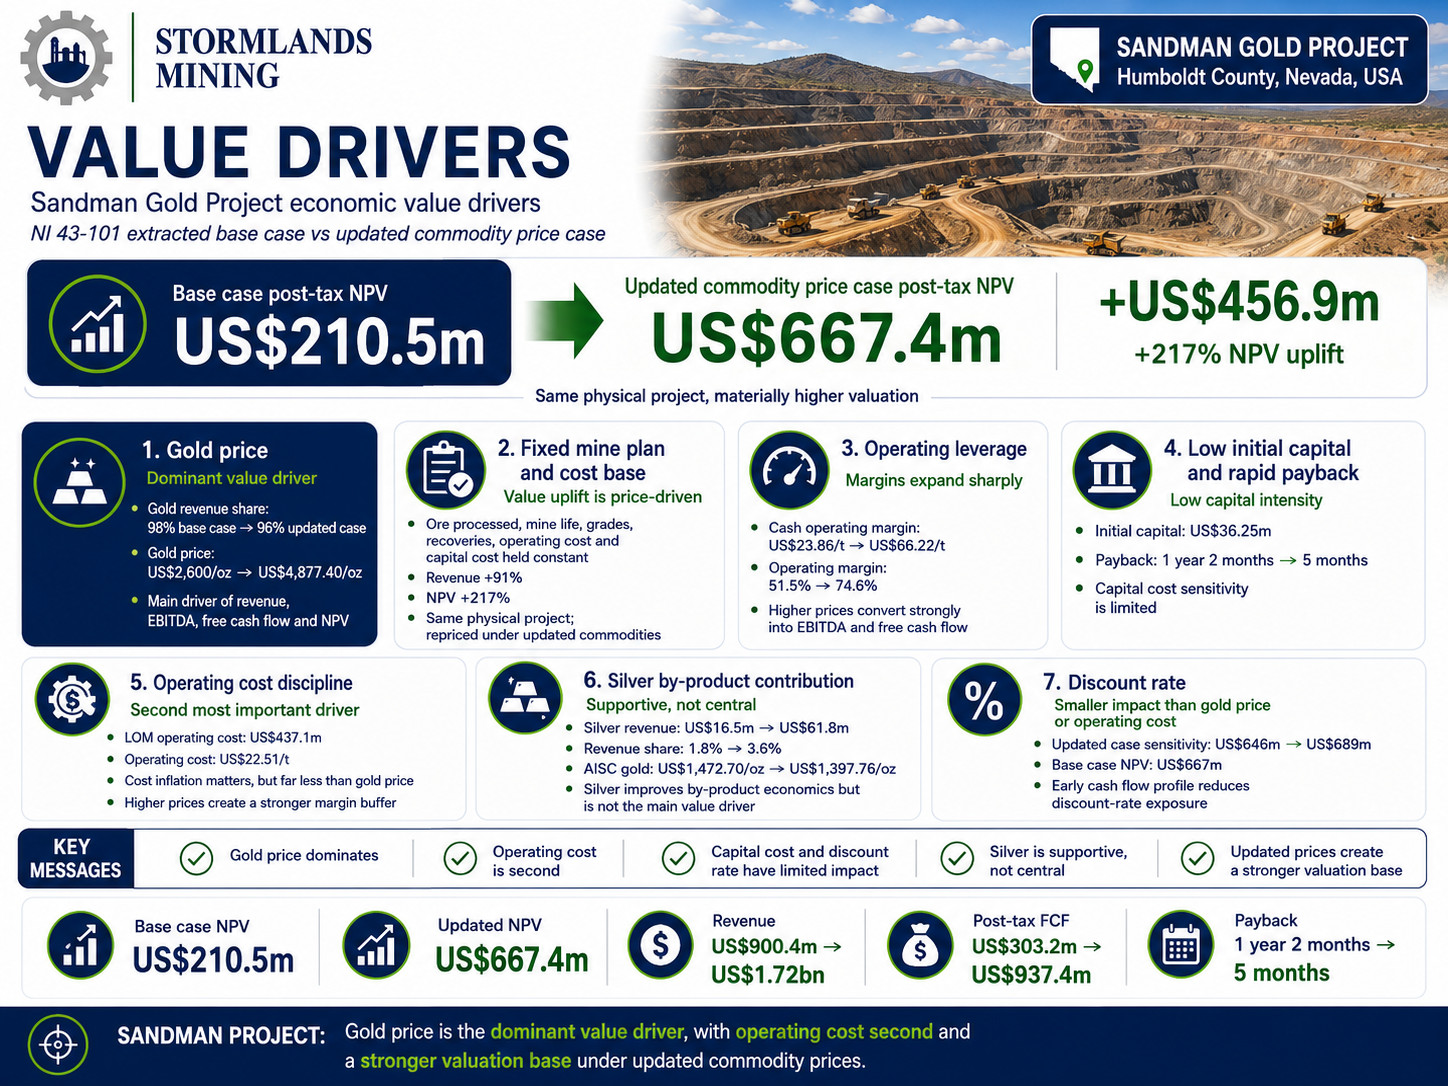
Value Drivers
1. Gold price
Gold price is the dominant value driver.
The sensitivity analysis, revenue report and heatmap all point to the same conclusion. Sandman’s revenue is overwhelmingly gold-driven, and the project’s valuation responds strongly to gold price movement.
In the base case, gold accounts for approximately 98% of revenue. In the updated commodity price case, gold still accounts for approximately 96% of revenue.
The updated commodity price case increases the gold price assumption from US$2,600/oz to US$4,877.40/oz. This drives the majority of the increase in revenue, EBITDA, free cash flow and NPV.
The project’s high gold price leverage is the central commercial feature of the model.
2. Fixed mine plan and cost base
The updated commodity price case holds the physical mine plan and cost base constant.
Ore processed, mine life, gold grade, silver grade, recovered metal, operating cost and capital cost remain unchanged between scenarios.
This creates a clean comparison. The increase in valuation is not driven by technical changes. It is driven by repricing the same physical project.
Because the cost base is unchanged, incremental revenue has a high conversion rate into free cash flow.
This is why revenue increases by approximately 91%, while post-tax project NPV increases by approximately 217%.
3. Operating leverage
Sandman has strong operating leverage because the cost base does not move with commodity prices in the model.
Life-of-mine operating cost remains approximately US$437.1 million in both cases. Life-of-mine capital cost including sustaining capital remains approximately US$56.95 million.
As commodity prices rise, a larger share of revenue is converted into operating margin, EBITDA and free cash flow.
Cash operating margin increases from approximately US$23.86/t ore to approximately US$66.22/t ore. Operating margin percentage increases from approximately 51.5% to approximately 74.6%.
This margin expansion is the key reason NPV increases faster than revenue.
4. Low initial capital and rapid payback
The model assumes initial capital of approximately US$36.25 million.
Relative to the project’s operating cash-flow potential, this is low. That low initial capital requirement contributes to high IRR and rapid payback in both cases.
In the NI 43-101 extracted case, payback is approximately 1 year and 2 months. In the updated commodity price case, payback improves to approximately 5 months.
The project’s value is therefore not highly sensitive to changes in capital cost. The capital cost sensitivity range is narrow in both models.
This supports the interpretation of Sandman as a low-capital-intensity, price-leveraged heap-leach gold project.
5. Operating cost discipline
Operating cost is the second most important value driver after gold price.
The model assumes life-of-mine operating cost of approximately US$437.1 million, or approximately US$22.51/t ore.
A 20% operating cost increase reduces project NPV materially, but the effect is much smaller than the effect of gold price movement.
In the updated commodity price case, operating cost inflation has a much smaller relative impact on valuation than in the NI 43-101 extracted case. This is because the higher price deck creates a larger margin buffer.
Operating cost discipline remains important, but the updated commodity price case materially improves resilience to cost pressure.
6. Silver by-product contribution
Silver is not the main value driver, but it improves the project’s by-product economics.
In the NI 43-101 extracted case, silver revenue is approximately US$16.5 million. In the updated commodity price case, silver revenue increases to approximately US$61.8 million.
Silver’s share of total revenue increases from approximately 1.8% to approximately 3.6%.
This helps reduce AISC from approximately US$1,472.70/oz gold to approximately US$1,397.76/oz gold.
However, the silver price sensitivity remains small. Sandman should therefore be understood as a gold project with modest silver by-product support, rather than a dual-commodity project.
7. Discount rate
Discount rate has a smaller impact than gold price or operating cost.
This partly reflects the project’s early cash-flow profile. A significant portion of value is generated early in the mine life, reducing the project’s relative exposure to discount-rate changes.
In the updated commodity price case, the discount rate sensitivity range is approximately US$646 million to US$689 million, compared with the base case NPV of approximately US$667 million.
Discount rate still matters, but it is not the primary driver of the investment case.
Commercial interpretation
Sandman is a strong example of why mining economic models should not remain static after a technical report is published.
The NI 43-101 extracted case already shows robust economics. At US$2,600/oz gold and US$20/oz silver, the Stormlands model generates a post-tax project NPV of approximately US$210.5 million, an IRR of approximately 101.2% and payback of approximately 1 year and 2 months.
However, when the same model is updated to US$4,877.40/oz gold and US$74.92/oz silver, the valuation changes materially. Project NPV increases to approximately US$667.4 million, IRR increases to approximately 267.7%, and payback improves to approximately 5 months.
The updated case does not rely on a revised mine plan, higher grade, additional ounces, improved recoveries or lower costs. It is the same economic model updated for commodity prices.
For investors, this provides a clearer view of current valuation exposure.
For mining companies, it provides a structured way to communicate how changes in market conditions affect project economics.
For advisers and analysts, it provides a repeatable workflow for comparing projects, testing sensitivities and identifying the assumptions that matter most.
For governments and local stakeholders, it shows how commodity price changes can increase not only shareholder value but also royalties and tax revenues.
In Sandman’s case, government revenues increase from approximately US$91.4 million to approximately US$269.9 million in the updated commodity price case.
This demonstrates that higher commodity prices can materially increase the fiscal contribution of a project as well as its investment returns.
Why this matters
Technical reports provide the foundation for understanding a mining project. However, they are static documents. Commodity prices, capital markets, development costs and investor expectations can move quickly after publication.
The Sandman case study demonstrates the value of converting technical disclosure into a live model.
A static technical report can tell users what the project looked like under a defined set of assumptions. A dynamic model can show how the project behaves as those assumptions change.
For Sandman, updating commodity prices alone increases life-of-mine revenue by approximately US$822.6 million, increases life-of-mine EBITDA by approximately US$802.8 million, increases post-tax project free cash flow by approximately US$634.2 million, and increases project NPV by approximately US$456.9 million.
The same physical project generates a very different valuation.
This type of analysis is difficult to perform quickly using static PDF disclosure alone. By rebuilding the project as a dynamic model, Stormlands can update price decks, compare scenarios, test sensitivities and show how project value changes across market conditions.
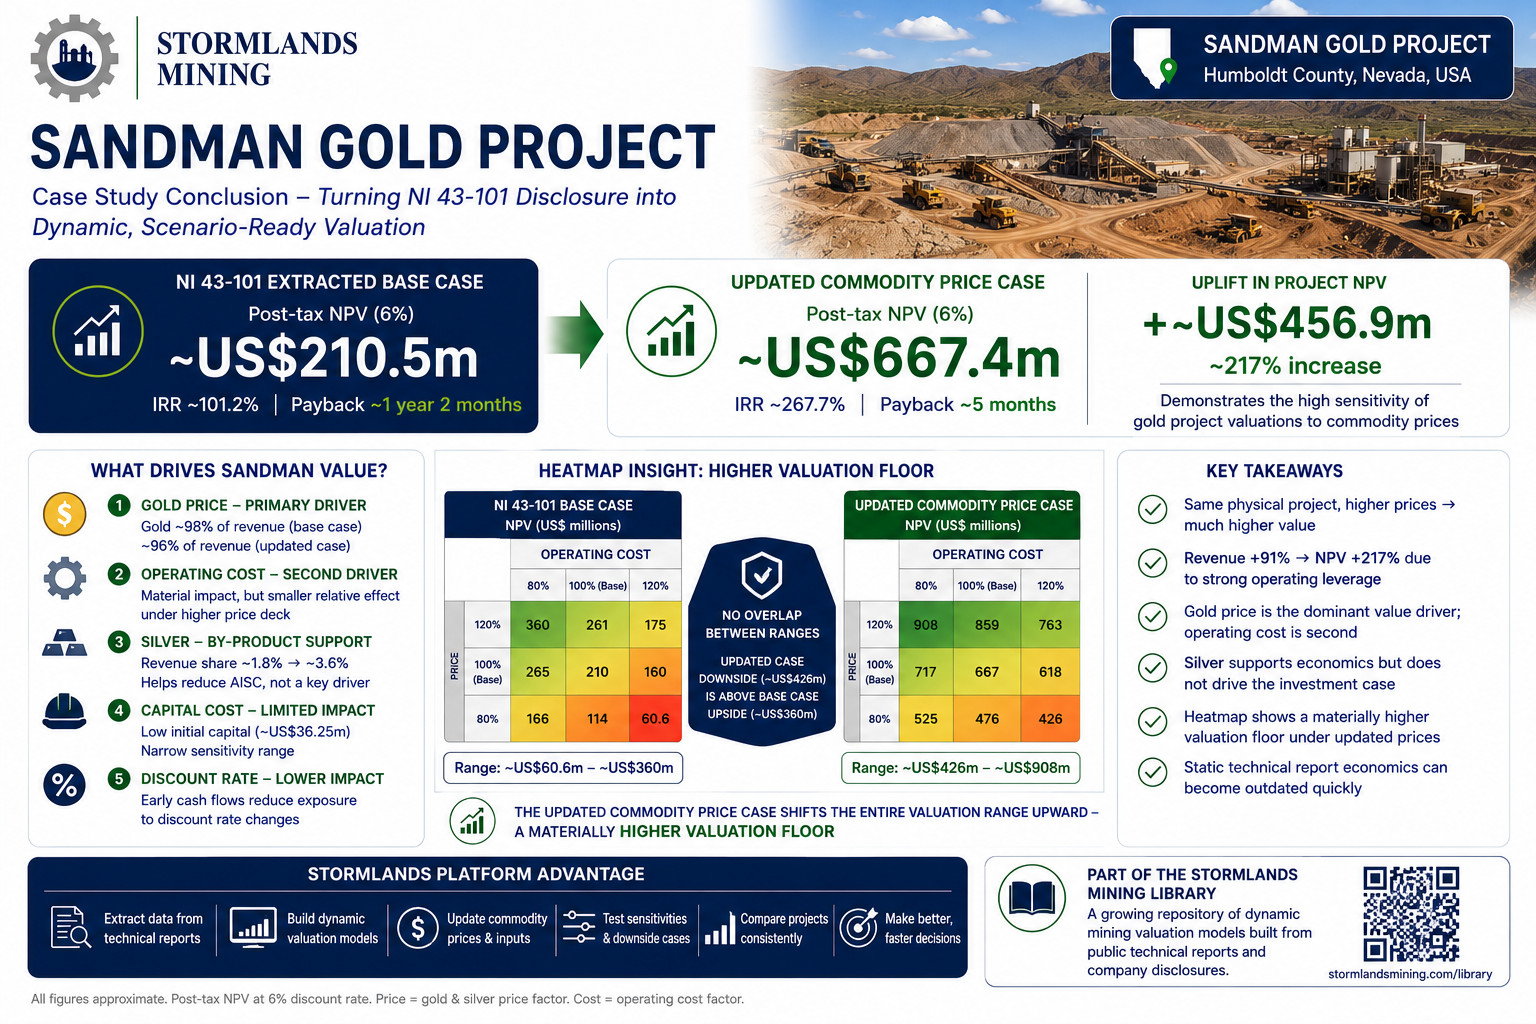
Conclusion
The Sandman Gold Project case study demonstrates the value of turning NI 43-101 technical disclosure into a dynamic, scenario-ready valuation model.
Using the NI 43-101 extracted assumptions, Stormlands modelled a base case project NPV of approximately US$210.5 million, with an IRR of approximately 101.2% and payback of approximately 1 year and 2 months.
Updating the same model to current commodity price assumptions increased project NPV to approximately US$667.4 million, with an IRR of approximately 267.7% and payback of approximately 5 months.
That uplift of approximately US$456.9 million illustrates how sensitive gold project valuations can be to commodity price assumptions, and why static technical report economics can quickly become outdated in fast-moving markets.
The analysis also shows that Sandman is primarily driven by gold price, with operating cost as the second most important value driver. Silver provides by-product support, but it does not drive the investment case. Capital cost and discount rate have more limited impact, reflecting the project’s low initial capital requirement and strong early cash-flow profile.
The heatmap analysis provides the clearest evidence of the re-rating effect. Under updated commodity prices, the project’s downside heatmap case remains above the NI 43-101 extracted model’s upside heatmap case. This indicates a materially higher valuation floor.
Stormlands enables users to extract data from technical reports, build valuation models, update commodity prices, test sensitivities, evaluate downside cases and compare projects in a consistent and transparent way.
The Sandman model is part of the Stormlands Mining Library, a growing repository of dynamic mining valuation models built from public technical reports and company disclosures.
About Stormlands
Stormlands Mining is an AI-first valuation and analytics platform for mining assets and critical minerals.
The platform enables users to turn technical disclosures into interactive valuation models in minutes, rather than days or weeks.
Stormlands enables users to build discounted cash flow models at scale, test commodity price, capex, opex, tax, royalty rate, discount-rate and production scenarios, and compare opportunities and scenarios.
Stormlands is using the platform to build the Stormlands Library: a global repository of mining asset valuation models. The Library provides a structured source of valuation models and illustrative scenarios, enabling users to screen assets, benchmark projects and understand the key drivers of mining asset economics.
Important Notice
This publication has been prepared by Stormlands Mining Ltd. for informational, educational and illustrative purposes only. It is based on publicly available information, including NI 43-101 Preliminary Economic Assessment with an effective date of 5 January 2026, together with independent modelling undertaken by Stormlands Mining.
Stormlands Mining has not been engaged by the project owner or its affiliates to prepare this analysis. This publication has not been reviewed, approved or endorsed by the project owner, its advisers, or any Qualified Person associated with the Project.
The analysis presented is not a Preliminary Economic Assessment, Pre-Feasibility Study, Feasibility Study, technical report, mineral resource estimate, mineral reserve estimate, valuation opinion, fairness opinion, investment research report, securities recommendation, offer to sell, solicitation to buy, or investment advice.
Stormlands Mining is not acting as a broker, dealer, investment adviser, corporate finance adviser, Qualified Person, or securities research provider in connection with this publication.
All model outputs are scenario-based and depend on the assumptions used, including commodity prices, exchange rates, discount rates, capital costs, operating costs, taxes, royalties, production schedules, payability, recoveries, treatment and refining charges, timing assumptions and other inputs. Actual results may differ materially from the scenarios presented. Commodity prices, costs, financing conditions, permitting timelines and project development outcomes are uncertain and subject to change.
Stormlands Mining does not represent or warrant that the information or model outputs are complete, accurate or suitable for any particular purpose. Readers should treat this publication as one source of information only and should conduct their own independent technical, financial, legal, tax and investment due diligence before making any decision.
Neither Stormlands Mining nor any of its directors, officers, employees or advisers accepts any liability for any loss arising from reliance on this publication or the information contained in it.