
Illinois Creek Gold Project
The analysis is based on Stormlands Mining’s independent modelling using publicly available technical information, including the NI 43-101 Technical Report January 2026.
Stormlands Mining illustrative economic analysis based on NI 43-101 MRE
Introduction
Stormlands Mining’s independent analysis of the Illinois Creek Project in western Alaska shows how a publicly available NI 43-101 Technical Report can be converted into an illustrative economic valuation model, even where no formal Preliminary Economic Assessment has been published.
Stormlands has used the technical disclosure as the starting point for an illustrative DCF model. The purpose is not to replace a PEA, PFS or DFS. Rather, the model shows how structured technical information can be translated into a dynamic economic framework that helps users understand scale, valuation sensitivity and the key assumptions that drive value.
The Illinois Creek model is particularly useful because it compares two scenarios:
- A NI43-derived base case using the commodity prices embedded in the technical Report effective date January 22 2026.
- An updated commodity price case using current gold and silver price assumptions.
The underlying resource, mine life, operating cost, capital cost and discount rate remain unchanged. What changes is the commodity price environment. That change materially alters the project’s implied economic profile.
Project Context
The Illinois Creek Project is a gold project located in western Alaska and is controlled by Alaska Silver Corp. The project includes oxide gold-silver mineralization at Illinois Creek and additional mineralization at Waterpump Creek.
For the Stormlands model, the core economic case is based on the Illinois Creek gold-silver resource assumptions. The model uses an ore body size of 10.3 million tonnes, with gold grade of 0.86 g/t and silver grade of 31.6 g/t. The model assumes total mine output of 9.79 million tonnes over a mine life of 10.27 years.
The modelled project is gold-led, but silver provides a meaningful secondary contribution. This is important because the updated commodity price scenario increases both gold and silver prices, with silver showing a particularly large price uplift.
Key Highlights
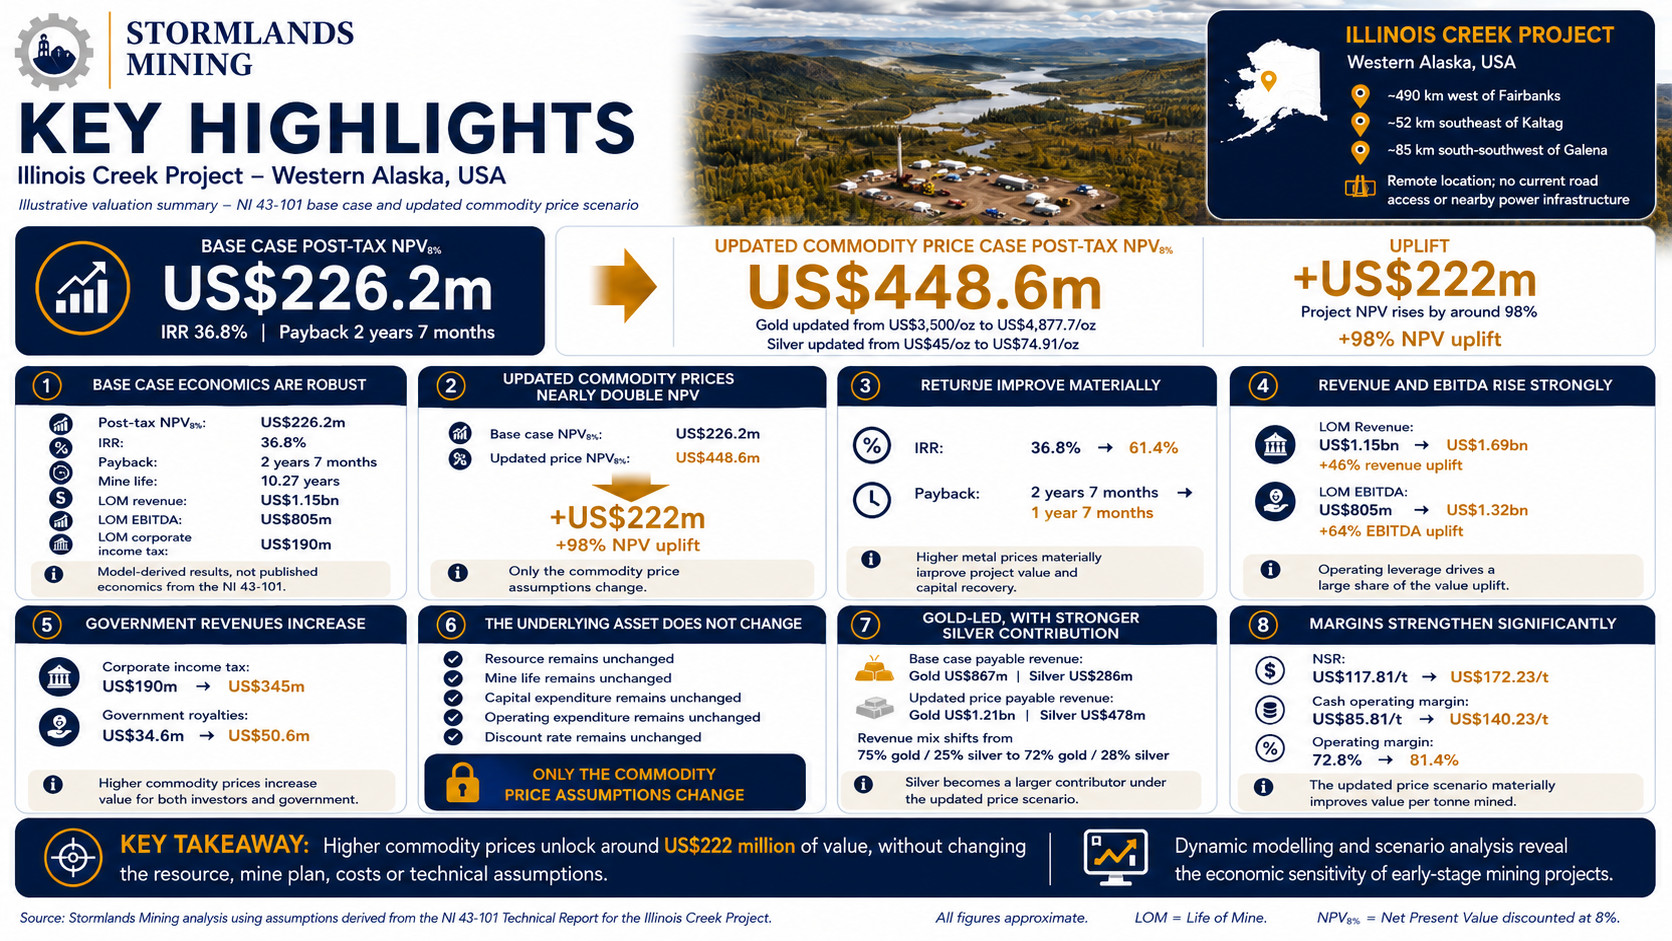
1. Base-case project NPV of US$226 million
Using the NI43-101 extracted data, the Stormlands model produces an illustrative post-tax project NPV of US$226.2 million at an 8% discount rate.
The commodity prices referenced in the NI 43-101 are:
Gold: US$3,500 per TOz
Silver: US$45 per TOz
The model produces:
- Post-tax project IRR of 36.8%
- Payback of 2 years and 7 months
- Mine life of 10.27 years
- Life-of-mine revenue of US$1.15 billion
- Life-of-mine EBITDA of US$805 million
- Life-of-mine corporate income tax of US$190 million
2. Updated commodity prices nearly double NPV
Updated commodity prices used (average of March 2026):
Gold: US$4,877.77 per TOz
Silver: US$74.91 per TOz
Under the updated commodity price scenario, project NPV increases from US$226.2 million to US$448.6 million.
That is an uplift of approximately US$222 million, or around 98%.
This is the clearest valuation insight from the Illinois Creek model. The underlying resource does not change. The mine life does not change. CAPEX and OPEX assumptions do not change. The discount rate remains the same. The main change is the market price environment.
3. IRR improves materially
The modelled project IRR increases from 36.8% in the NI43-derived case to 61.4% in the updated commodity price case.
This shows that stronger gold and silver prices do not simply increase NPV. They also materially improve the project’s return profile.
4. Payback shortens by one year
The modelled payback period improves from 2 years and 7 months to 1 year and 7 months.
This is important because payback is a practical risk measure. A shorter payback period means capital is recovered faster, reducing exposure to long-term commodity price, operating and development risks.
5. Revenue and EBITDA uplift are substantial
Life-of-mine revenue increases from US$1.15 billion to US$1.69 billion.
Life-of-mine EBITDA increases from US$805 million to US$1.32 billion.
This shows strong operating leverage. Because operating costs are held constant in the model, a large portion of the revenue uplift flows through to EBITDA and free cash flow.
6. Higher commodity prices increase government revenue
Modelled life-of-mine corporate income tax increases from US$190 million to US$345 million.
Modelled government royalties increase from US$34.6 million to US$50.6 million.
This is an important case-study point. Stronger commodity prices increase value not only for investors and project owners, but also for government through higher tax and royalty flows.
7. The project is gold-led, but silver becomes more important
Gold remains the largest revenue contributor in both model cases.
In the NI43-derived case, gold contributes approximately US$867 million of payable revenue, while silver contributes approximately US$286 million. In the updated commodity price case, gold revenue increases to approximately US$1.21 billion, while silver revenue increases to approximately US$478 million.
The revenue mix changes from approximately 75% gold and 25% silver to approximately 72% gold and 28% silver. This shows that silver becomes a larger contributor under the updated price scenario.
8. Margins strengthen significantly
Net smelter return increases from US$117.81/t ore to US$172.23/t ore.
Cash operating margin increases from US$85.81/t ore to US$140.23/t ore.
Operating margin increases from 72.8% to 81.4%.
This shows that the updated price scenario materially improves value per tonne mined and creates a wider margin cushion.
DCF model insights
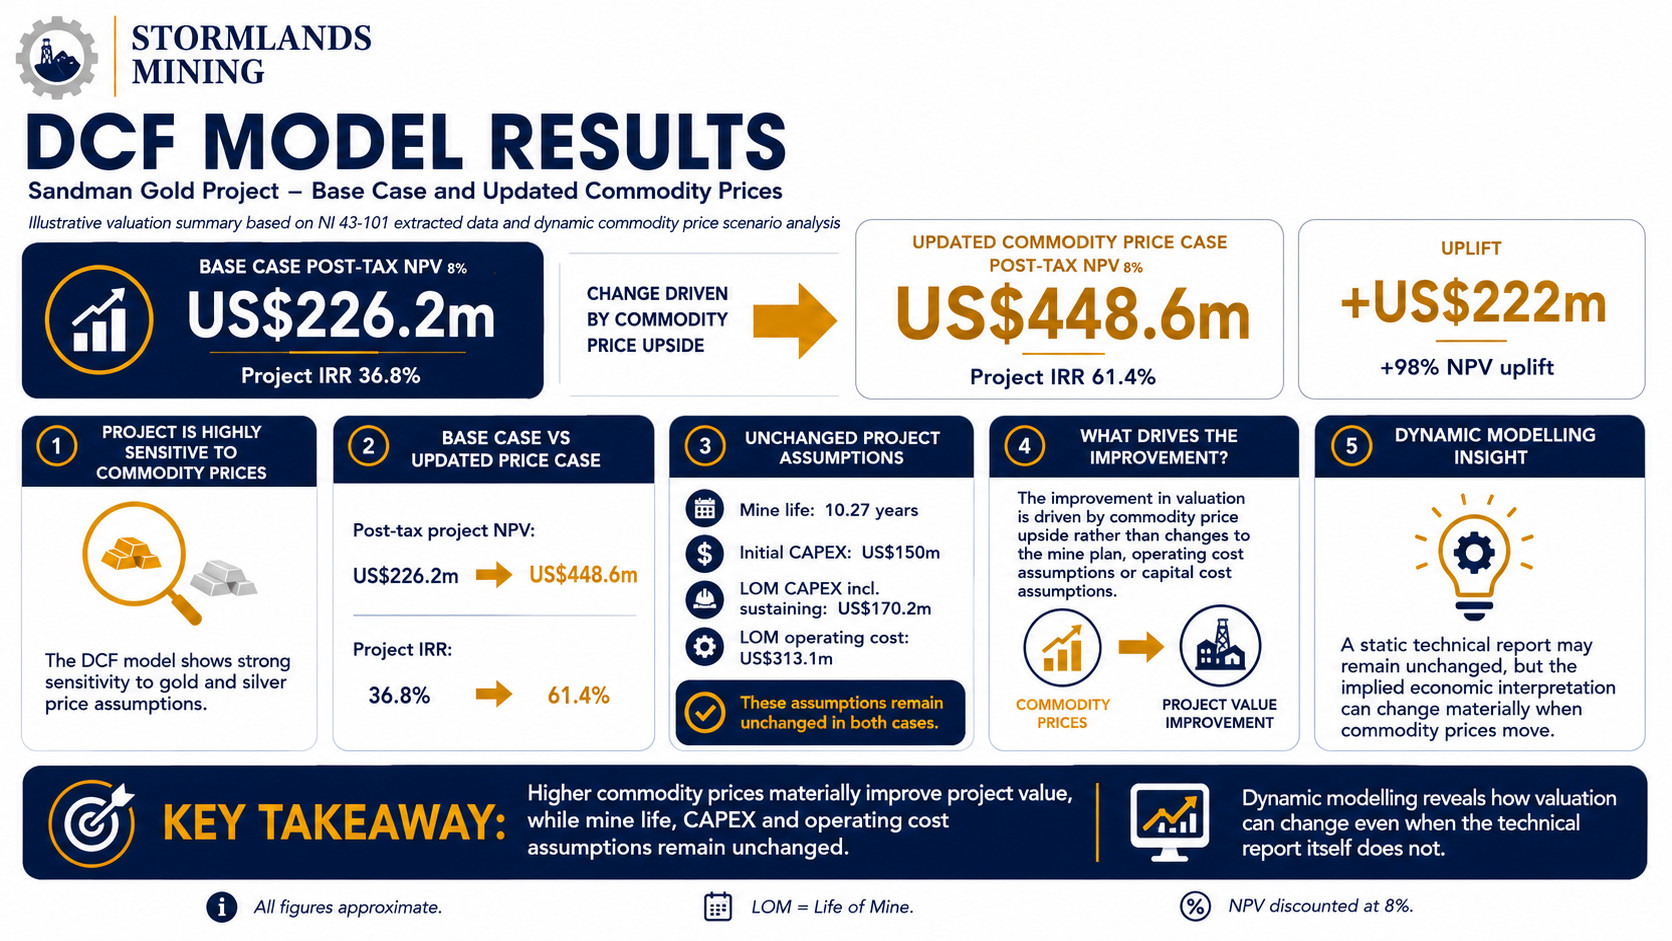
The DCF model shows that Illinois Creek is highly sensitive to gold and silver price assumptions.
The NI43-derived model produces a post-tax project NPV of US$226.2 million and project IRR of 36.8%. Under updated commodity prices, post-tax project NPV increases to US$448.6 million and project IRR increases to 61.4%.
The modelled mine life remains 10.27 years in both cases. Initial CAPEX remains US$150 million, and life-of-mine CAPEX including sustaining capital remains US$170.2 million. Life-of-mine operating cost remains US$313.1 million.
Because these assumptions are unchanged, the improvement in valuation is driven by commodity price upside rather than changes to the mine plan, operating cost assumptions or capital cost assumptions.
This is the core value of dynamic modelling. A static technical report may remain unchanged, but the implied economic interpretation can change materially when commodity prices move.
Updated Commodity Price Scenario
The base case uses:
- Gold price: US$3,500/oz
- Silver price: US$45/oz
The updated commodity price case uses:
- Gold price: US$4,877/oz
- Silver price: US$74.91/oz
Under this updated price scenario:
- Life-of-mine revenue increases from US$1.15 billion to US$1.69 billion.
- Life-of-mine EBITDA increases from US$805 million to US$1.32 billion.
- Post-tax project NPV increases from US$226.2 million to US$448.6 million.
- Project IRR increases from 36.8% to 61.4%.
- Payback improves from 2 years and 7 months to 1 year and 7 months.
The resource has not changed. The mine life has not changed. CAPEX and OPEX have not changed. What changes is the commodity price environment.
That change materially improves the project’s implied economic profile.
Value Drivers
1. Overall price factor
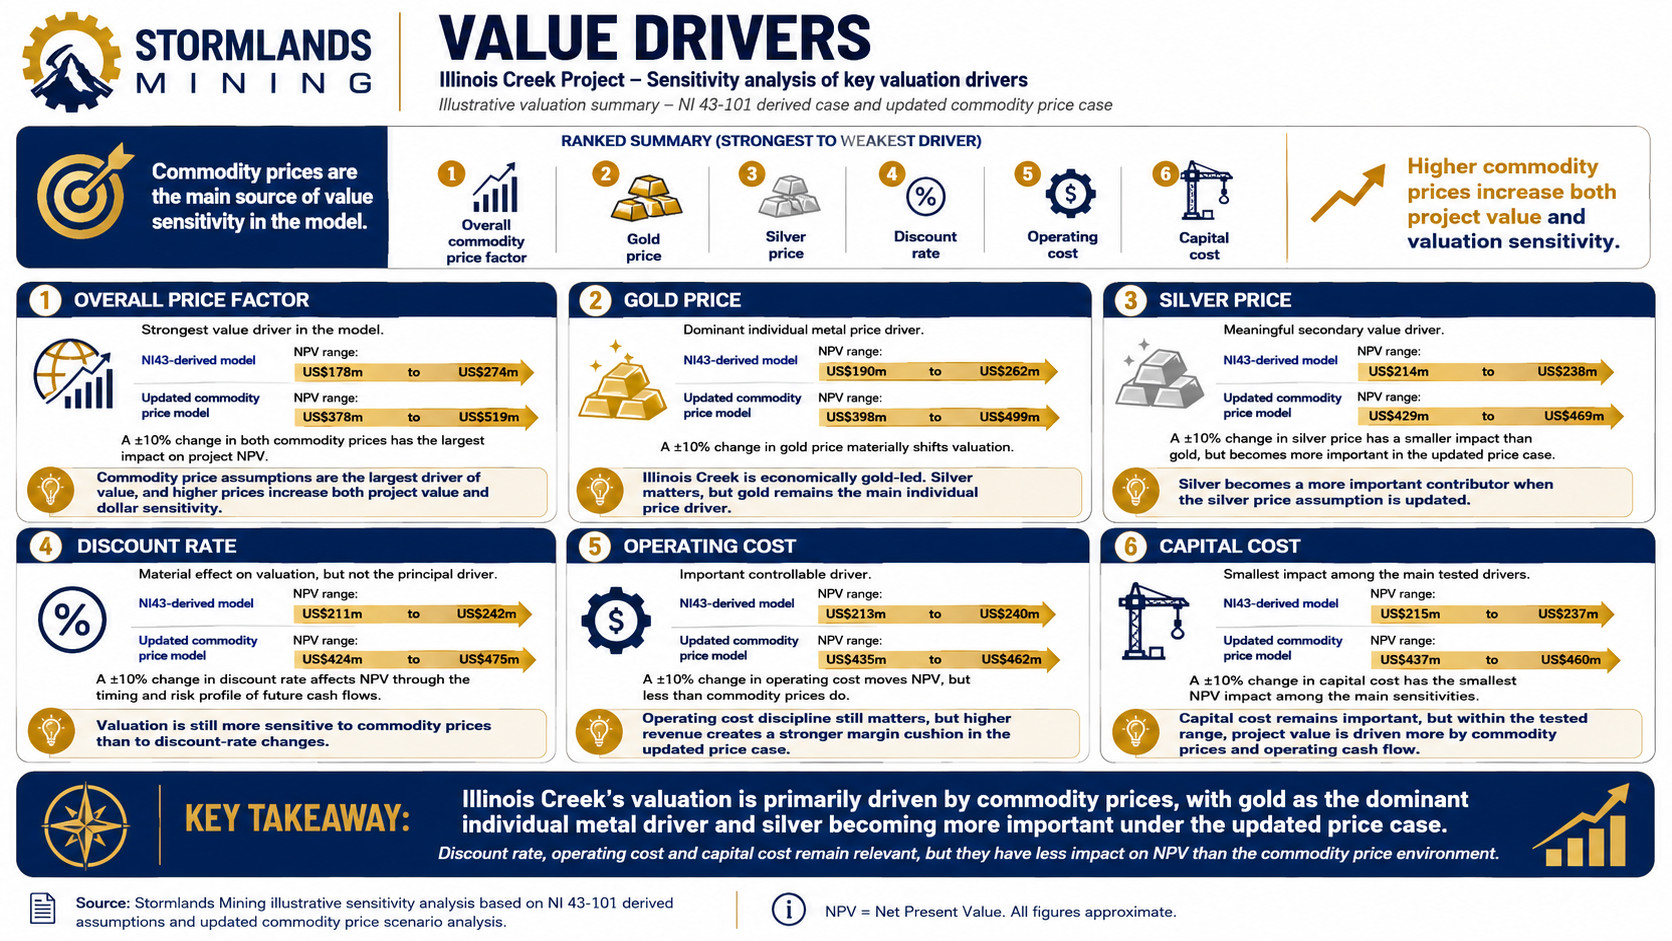
The strongest value driver in the Stormlands model is the overall commodity price factor.
In the NI43-derived model, a 10% increase or decrease in both commodity prices moves project NPV from US$178 million to US$274 million.
In the updated commodity price model, the same price factor sensitivity moves project NPV from US$378 million to US$519 million.
This confirms that commodity price assumptions are the largest driver of value. It also shows that higher commodity prices increase both the value of the project and the dollar amount of valuation sensitivity.
2. Gold price
Gold is the dominant individual metal price driver.
In the NI43-derived model, a 10% increase or decrease in gold price moves project NPV from US$190 million to US$262 million.
In the updated commodity price model, a 10% increase or decrease in gold price moves project NPV from US$398 million to US$499 million.
This confirms that Illinois Creek behaves economically as a gold-led project. Silver is important, but gold remains the main individual price driver.
3. Silver price
Silver is a meaningful secondary value driver, and its role increases under the updated commodity price case.
In the NI43-derived model, a 10% increase or decrease in silver price moves project NPV from US$214 million to US$238 million.
In the updated commodity price model, a 10% increase or decrease in silver price moves project NPV from US$429 million to US$469 million.
This shows that silver becomes more important when the silver price assumption is updated. The model helps separate the project’s headline gold-silver profile from the actual value contribution of each metal.
4. Operating cost
Operating cost is an important controllable driver, but it is less influential than commodity prices.
In the NI43-101 model, a 10% decrease or increase in operating cost moves NPV from US$213 million to US$240 million.
In the updated commodity price model, a 10% decrease or increase in operating cost moves NPV from US$435 million to US$462 million.
This indicates that operating cost discipline still matters, but higher revenue creates a stronger margin cushion in the updated price case.
5. Capital cost
Capital cost has the smallest impact among the main tested drivers.
In the NI43-derived model, a 10% decrease or increase in capital cost moves NPV from US$215 million to US$237 million.
In the updated commodity price model, a 10% decrease or increase in capital cost moves NPV from US$437 million to US$460 million.
This does not mean capital cost is unimportant. It means that, within the tested sensitivity range, valuation is driven more by commodity prices and operating cash flow than by capital cost variation.
Stormlands Heatmap
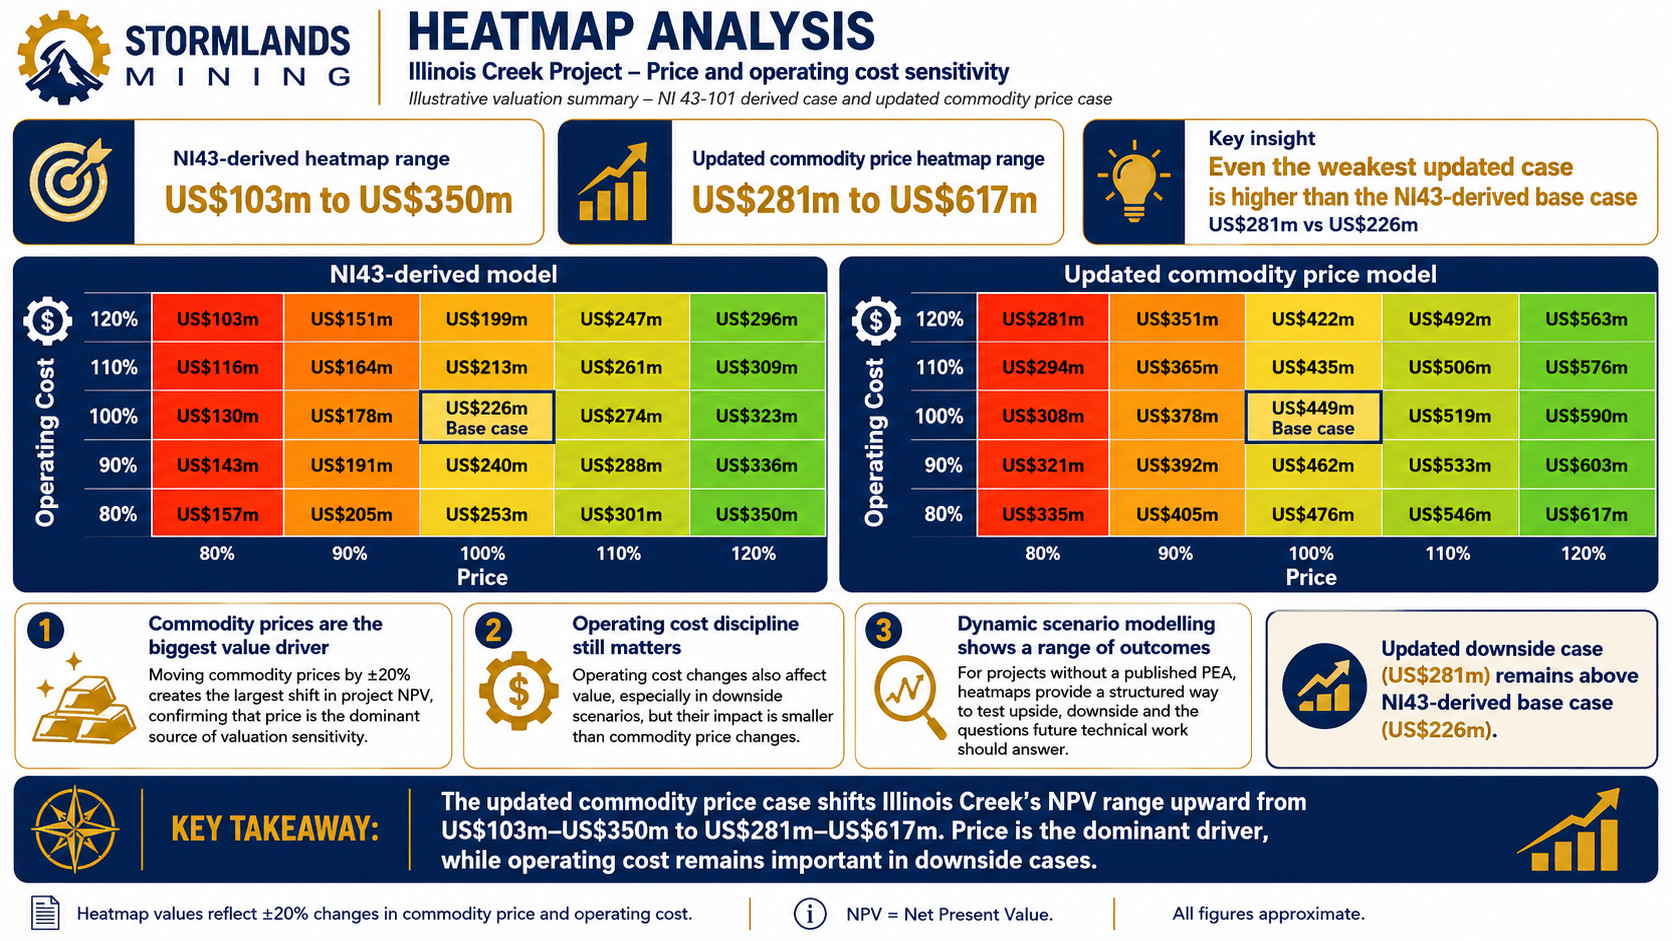
The Stormlands heatmap shows the combined impact of commodity price and operating cost changes on project NPV. The Stormlands heatmap recalculates the NPV using a 20% decrease and 20% increase in input values. In this case, the input values used were operating cost and commodity price.
In the NI43-derived model, the heatmap range is US$103 million to US$350 million.
At the low end, 80% price and 120% operating cost reduce NPV to US$103 million. At the high end, 120% price and 80% operating cost increase NPV to US$350 million.
In the updated commodity price model, the heatmap range shifts upward to US$281 million to US$617 million.
At the low end, 80% price and 120% operating cost still produce an NPV of US$281 million. At the high end, 120% price and 80% operating cost increase NPV to US$617 million.
This is one of the clearest results from the heatmap. Even the weakest updated commodity price case is higher than the NI43-derived base case.
The heatmap reinforces three conclusions:
- First, commodity prices are the largest driver of value.
- Second, operating cost control remains important, especially in downside cases.
- Third, dynamic scenario modelling helps users understand a range of outcomes rather than relying on a single static value.
For a project without a published PEA, this is especially useful. It provides a structured way to frame the economic questions that should be tested before more detailed technical and engineering studies are completed.
Price and Cost Interaction
The heatmaps also show that price movement has a much larger impact than operating cost movement.
In the NI43-derived model, changing price from 80% to 120% at base operating cost moves NPV from US$130 million to US$323 million. That is a swing of approximately US$193 million.
In the updated commodity price model, the same price movement at base operating cost moves NPV from US$308 million to US$590 million. That is a swing of approximately US$282 million.
By comparison, changing operating cost from 120% to 80% at base price moves NPV by approximately US$54 million in both models.
This confirms that Illinois Creek’s valuation is much more exposed to commodity price assumptions than to operating cost variation. Cost control still matters, but price is the dominant driver.
Metal Revenue Mix
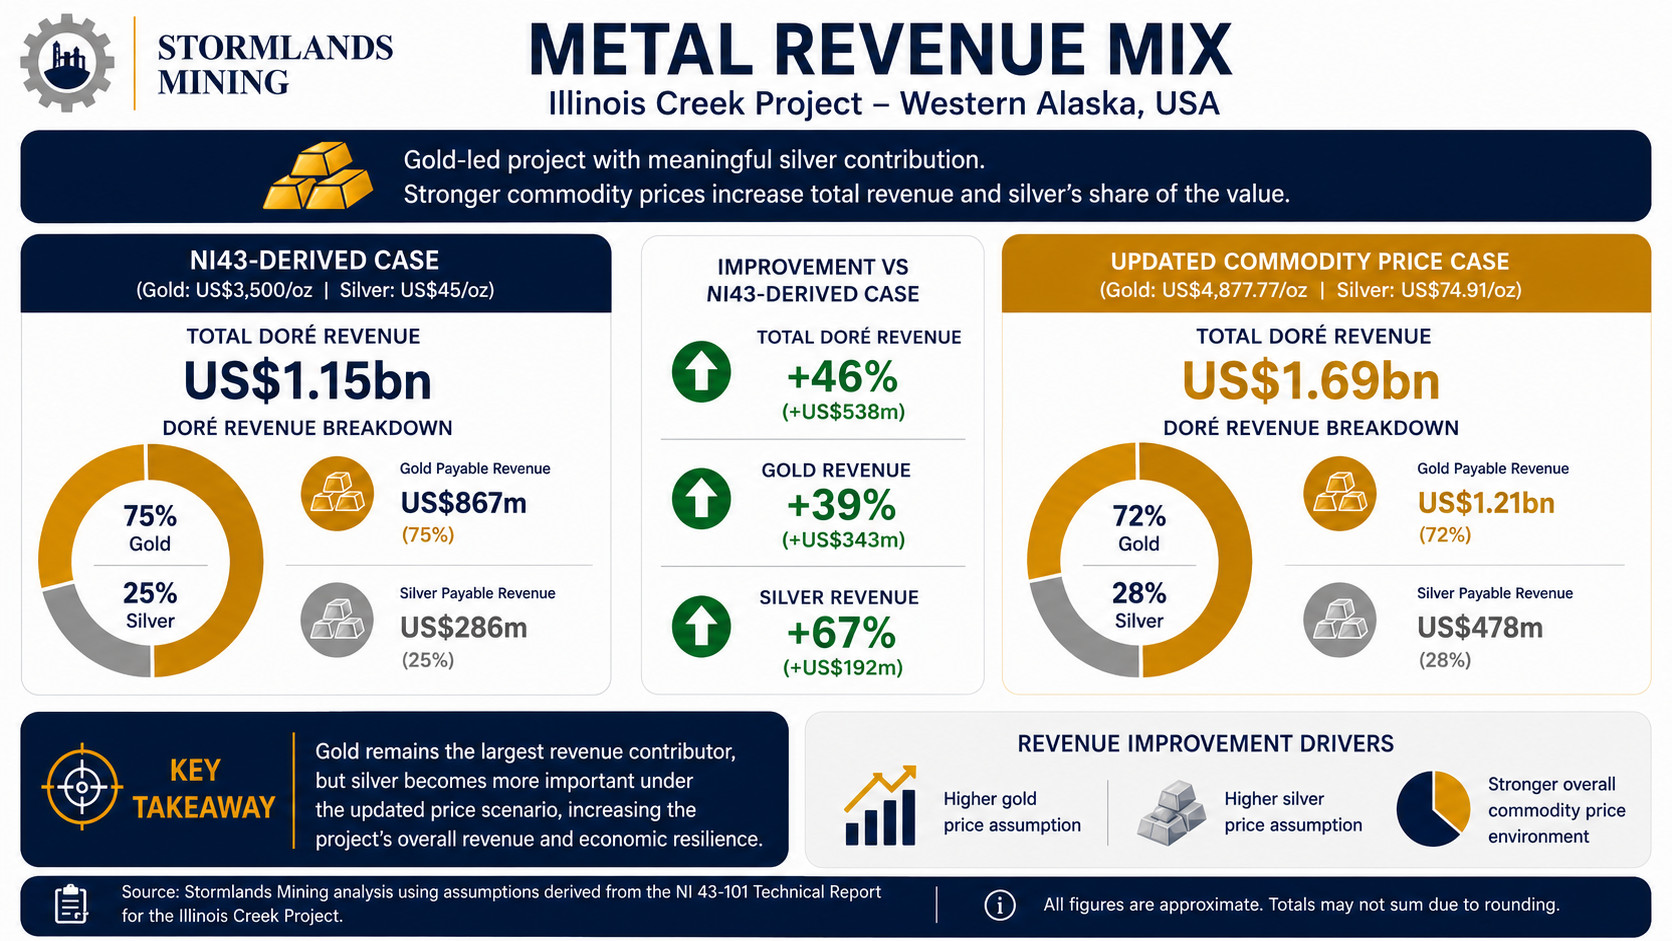
The modelled revenue profile shows that Illinois Creek is gold-led, with silver providing meaningful secondary value.
In the NI43-derived case:
- Gold payable revenue is approximately US$867 million.
- Silver payable revenue is approximately US$286 million.
- Total doré revenue is approximately US$1.15 billion.
- In the updated commodity price case:
- Gold payable revenue increases to approximately US$1.21 billion.
- Silver payable revenue increases to approximately US$478 million.
- Total doré revenue increases to approximately US$1.69 billion.
Gold remains the largest contributor, but silver becomes more important under the updated price scenario. This is important because it shows that Illinois Creek’s value is not simply a function of gold. Silver price movements can materially improve overall project economics.
Margin and Break-even Insights
The updated commodity price scenario materially improves the value of each tonne mined.
- Net smelter return increases from US$117.81/t ore to US$172.23/t ore.
- Cash operating margin increases from US$85.81/t ore to US$140.23/t ore.
- Operating margin increases from 72.8% to 81.4%.
- The model also shows a significant improvement in break-even metrics.
- The modelled break-even gold price falls from US$1,321/oz to US$550/oz.
- The break-even cut-off grade for gold falls from 0.31 g/t to 0.22 g/t.
- The mine design cut-off grade for gold falls from 0.48 g/t to 0.34 g/t.
These outputs show how stronger commodity prices can improve both valuation and planning flexibility. Lower break-even thresholds suggest a wider cushion against price downside and potentially broader economic material within the modelled framework.
Conclusion
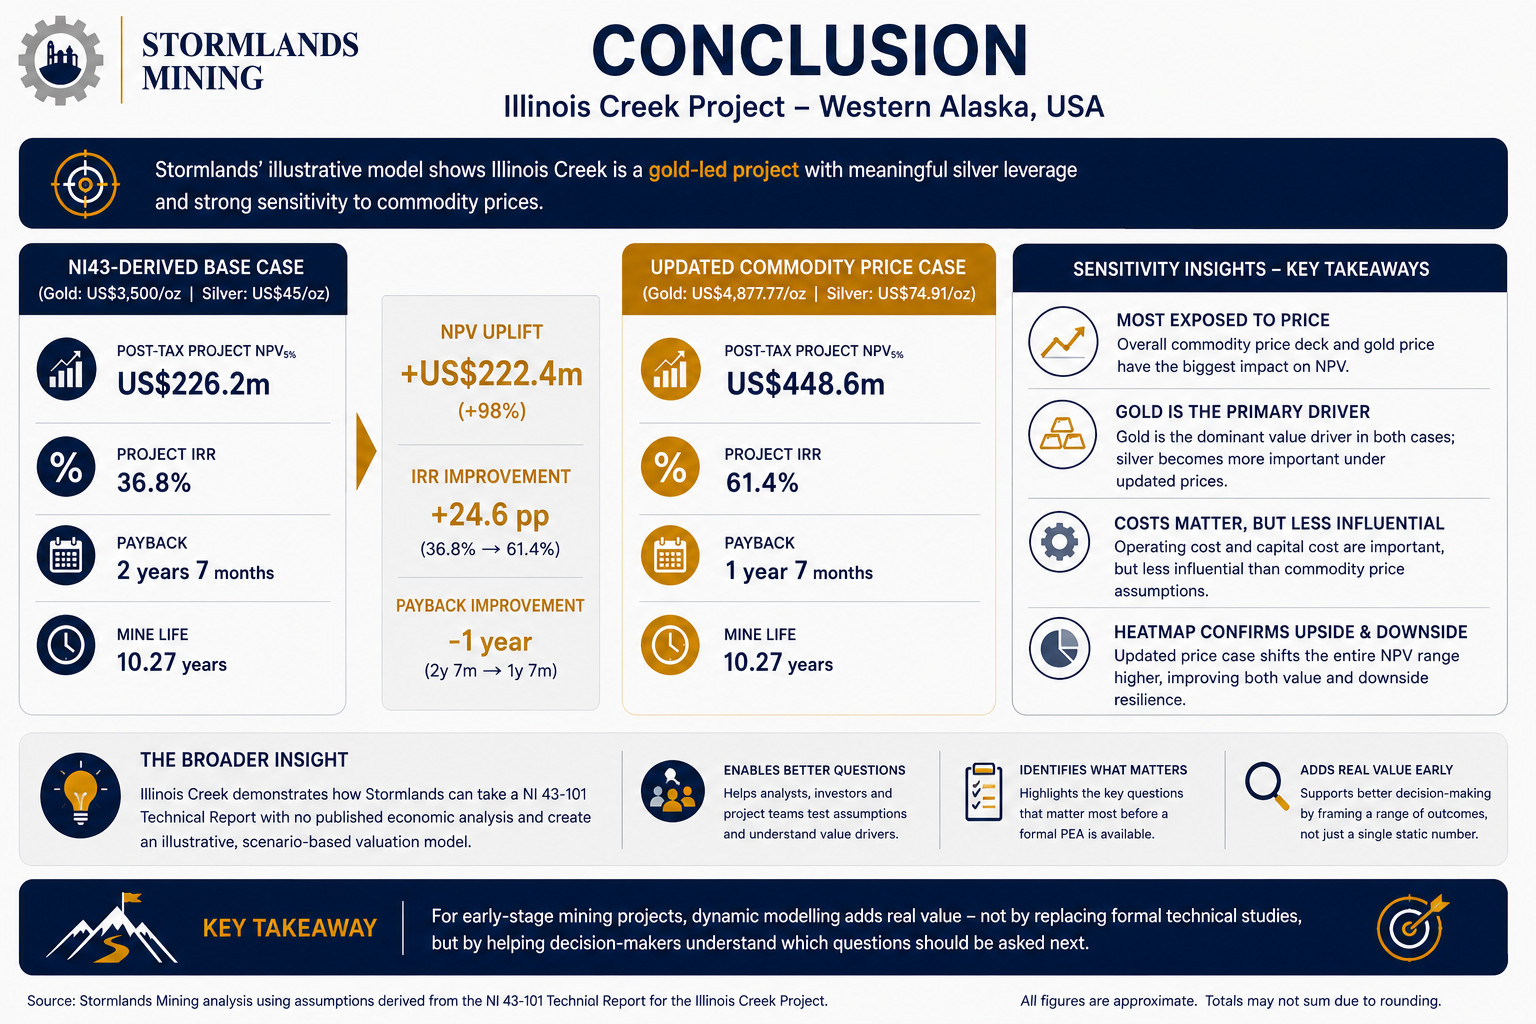
Stormlands’ illustrative model of the Illinois Creek Project shows a gold-led project with meaningful silver leverage and strong sensitivity to commodity prices.
Under the NI43-derived base case, the model produces an illustrative post-tax project NPV of US$226.2 million, project IRR of 36.8%, and payback of 2 years and 7 months.
Under the updated commodity price scenario, project NPV increases to US$448.6 million, project IRR improves to 61.4%, and payback shortens to 1 year and 7 months.
The sensitivity analysis and heatmaps show that Illinois Creek is most exposed to the overall commodity price deck and gold price. Silver becomes a more important value driver under updated prices, while operating cost and capital cost remain relevant but less influential than commodity price assumptions.
The broader insight is more important than the individual numbers.
Illinois Creek demonstrates how Stormlands can take a NI 43-101 Technical Report with no published economic analysis and create an illustrative, scenario-based valuation model. This gives analysts, investors and project teams a way to test assumptions, understand value drivers and identify the questions that matter most before a formal PEA is available.
For early-stage mining projects, this is where dynamic modelling can add real value: not by replacing formal technical studies, but by helping decision-makers understand which questions should be asked next.
About Stormlands
Stormlands Mining is an AI-first valuation and analytics platform for mining assets and critical minerals. The platform helps users turn technical disclosures into interactive valuation models in minutes, rather than days or weeks. The valuation models are accessible over multiple platforms to all users, enabling the user to interact directly with the data to facilitate scenario-planning.
The platform enables users to build discounted cash flow models at scale, test commodity price, capex, opex, tax, royalty rates, discount-rates and production scenarios, and compare opportunities and scenarios.
Stormlands is using this technology to build the Stormlands Library: a global repository of mining asset valuation models. It has moved beyond a tool for analysts building individual models and is developing a data layer for the mining industry: a structured source of valuation models and illustrative scenarios. This creates a new way for investors, corporates, professional advisers, financial-market users and public-policy stakeholders to screen assets, benchmark projects and understand the key drivers of mining asset economics.
If you are interested in accessing the models in the library, email ceo@stormlandsmining.com
Important Notice
This analysis has been prepared by Stormlands Mining using publicly available information from the NI 43-101 Technical Report together with Stormlands’ own independent modelling assumptions.
The analysis is illustrative only. It is not a Preliminary Economic Assessment, Pre-Feasibility Study, Feasibility Study, Mineral Reserve estimate or independent technical report. It has not been prepared on behalf of the project owner and has not been reviewed or approved by the project owner.
The model outputs are Stormlands-generated illustrative estimates only. They should not be interpreted as demonstrated economic viability. Future technical work, including mine planning, metallurgical testing, engineering, environmental studies, permitting, capital-cost estimation and operating-cost estimation, would be required before any formal economic conclusions could be drawn.