
Stormlands Mining publishes independent case study on Fremont Gold Property
Illustrative model shows a 20.8% increase in gold price more than doubles post-tax Project NPV to US$511.5 million
Dublin, Ireland — 04 August 2026 — Stormlands Mining has published a new independent case study on the Fremont Gold Property in Mariposa County, California, USA.
Using data extracted from the 2026 NI 43-101 Updated Technical Report for the Fremont Gold Property, effective date May 15 2026, Stormlands created an illustrative economic model based on the project’s 20 million-tonne Indicated Mineral Resource grading 1.79 g/t gold.
Using the US$3,515/oz gold price applied in the technical report’s Mineral Resource calculations, the Stormlands report-based model generates:
- Post-tax Project Net Present Value (NPV) of US$254.7 million
- Project IRR of 11.16%
- Payback of eight years and six months
- Life-of-mine revenue of US$3.45 billion
- Life-of-mine EBITDA of US$1.77 billion
- Post-tax Project free cash flow of US$811.7 million
- Modelled mine life of 27.4 years
- Initial capital requirement of US$350 million
Stormlands then updated the model using a gold price of US$4,245.22/oz (average of June 2026) while holding the underlying physical and cost assumptions constant, including resource tonnage, grade, recovery, production rate, mine life, capital expenditure, operating expenditure and discount rate.
Under the updated gold-price scenario, post-tax Project NPV increases from US$254.7 million to US$511.5 million. This represents an increase of approximately US$256.8 million, or 100.8%, resulting from a 20.8% increase in the gold price.
Project IRR increases from 11.16% to 16.66%, while modelled payback improves from eight years and six months to five years and eleven months.
Life-of-mine revenue increases from US$3.45 billion to US$4.17 billion. Life-of-mine EBITDA increases from US$1.77 billion to US$2.47 billion, while post-tax Project free cash flow increases from US$811.7 million to approximately US$1.31 billion.
Modelled corporate income tax increases from US$315.7 million to US$510.5 million. Payments under the project’s 3% third-party net smelter return royalty increase from US$103.6 million to US$125.1 million.
The resource, production profile, recovery assumptions, capital requirements, operating-cost assumptions and discount rate remain unchanged between the two scenarios. The increase in modelled value is driven by the higher gold-price assumption.
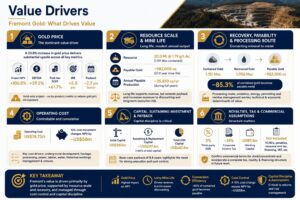
Gold price is Fremont’s dominant value driver
Stormlands’ sensitivity analysis (+/- 10% in key value drivers) identifies gold price as the strongest economic value driver in the Fremont model.
Across the tested gold-price range (+/- 10%), Project NPV moves between approximately US$131 million and US$378 million, creating a total valuation range of approximately US$247 million.
- Operating-cost sensitivity (+/- 10%) moves NPV between US$197 million and US$313 million, a range of US$116 million.
- Discount-rate sensitivity (+/- 10%) moves NPV between US$223 million and US$290 million, a range of US$67 million.
- Capital-cost sensitivity (+/- 10%) moves NPV between US$226 million and US$283 million, a range of US$57 million.
Within the tested ranges, gold price has more than twice the impact of operating cost and more than four times the impact of capital cost.
Operating cost remains the most important controllable value driver. The model assumes an operating cost of US$78.73 per tonne and life-of-mine operating expenditure of approximately US$1.57 billion.
Combined scenarios reveal downside risk
Stormlands also tested gold price and operating cost simultaneously across a differential of between 80% and 120%.
At the centre of the heatmap, using 100% of the report-based gold price and operating-cost assumptions, Project NPV is approximately US$255 million.
At 120% of the base gold price and 80% of the base operating cost, Project NPV increases to approximately US$618 million.
However, at 80% of the base gold price and 120% of the base operating cost, Project NPV falls to approximately negative US$109 million.
A 20% reduction in gold price combined with a 10% increase in operating cost also produces a negative NPV of approximately US$50.6 million.
The heatmap demonstrates why testing economic assumptions together can provide a more complete view of project risk than changing one variable at a time.
At the base operating cost, a 10% movement in gold price changes Project NPV by approximately US$123 million. At the base gold price, a 10% movement in operating cost changes NPV by approximately US$58 million.
A percentage movement in gold price therefore has approximately 2.1 times the NPV impact of an equivalent percentage movement in operating cost.
Róisín O’Connell, CEO, Stormlands Mining said: “Mining does not have a shortage of technical data. It has a shortage of data standards. The industry still asks investors and project teams to compare major capital-allocation decisions using assumptions trapped in hundreds of pages of PDFs, spreadsheets and one-off consultant models.
“AI will not transform mining simply by reading more reports. It will transform mining when technical disclosure is converted into consistent, machine-readable economic data that can be compared, updated and stress-tested continuously.
“Fremont shows what becomes possible when we stop treating the technical report as the end product and start treating it as the raw material for decision intelligence.”
-ENDS-
Notes
The Fremont Gold Property is a gold project located in Mariposa County, California, approximately 20 km northwest of the town of Mariposa.
The property is owned by Fremont Gold Mining LLC, a wholly owned subsidiary of Lode Gold Resources Inc.
The Stormlands model is based on the 20 Mt Indicated Mineral Resource grading 1.79 g/t Au reported in the 2026 NI 43-101 Updated Technical Report. The additional 39 Mt Inferred Mineral Resource is excluded from the illustrative production model.
| Metric | Report-based case | Updated gold-price case |
| Gold price | US$3,515/oz | US$4,245.22/oz |
| Project NPV | US$254.7m | US$511.5m |
| Project IRR | 11.16% | 16.66% |
| Payback | 8 years 6 months | 5 years 11 months |
| Life-of-mine revenue | US$3.45bn | US$4.17bn |
| Life-of-mine EBITDA | US$1.77bn | US$2.47bn |
| Post-tax Project FCFF | US$811.7m | US$1.31bn |
| Initial capital | US$350m | US$350m |
| Operating cost | US$78.73/t | US$78.73/t |
| Mine life | 27.4 years | 27.4 years |
| Discount rate | 5% | 5% |
Stormlands Library
The Fremont model forms part of the Stormlands Mining Library, a growing repository of structured mining-asset valuation models developed from public technical reports and company disclosures.
The case study demonstrates how a Mineral Resource technical report can be converted into an illustrative, scenario-driven economic framework before a current formal economic study has established project economics.
The framework enables users to examine commodity-price leverage, operating-cost exposure, capital efficiency, cash-flow timing, recovery, cut-off-grade implications, taxes, royalties and combined downside scenarios.
The full Fremont Gold Property case study will be available through the Stormlands Mining Library:
https://www.stormlandsmining.com/library/fremont-property/
Important notice
This publication has been prepared by Stormlands Mining Ltd. for informational, educational and illustrative purposes only. It is based on publicly available information, including the 2026 NI 43-101 Updated Technical Report for the Fremont Gold Property, together with independent modelling undertaken by Stormlands Mining.
Stormlands Mining has not been engaged by Lode Gold Resources Inc., Fremont Gold Mining LLC or their affiliates to prepare this analysis. This publication has not been reviewed, approved or endorsed by Lode Gold Resources Inc., Fremont Gold Mining LLC, their advisers or any Qualified Person associated with the Fremont Gold Property.
The analysis presented is not a technical report, Mineral Resource Estimate, Mineral Reserve Estimate, Preliminary Economic Assessment, prefeasibility study, feasibility study, valuation opinion, fairness opinion, investment research report, securities recommendation, offer to sell, solicitation to buy or investment advice.
The 2026 technical report used for this analysis does not publish current project economics equivalent to a formal Preliminary Economic Assessment. The Stormlands model is an illustrative economic model prepared from publicly available information and Stormlands’ independent assumptions. It should not be interpreted as demonstrating economic viability.
Mineral Resources that are not Mineral Reserves do not have demonstrated economic viability. There is no certainty that all or any part of the Mineral Resources will be converted into Mineral Reserves.
Future technical work, including mine planning, metallurgical testing, engineering, environmental studies, permitting, capital-cost estimation and operating-cost estimation, would be required before formal economic conclusions could be drawn.
Stormlands Mining is not acting as a broker, dealer, investment adviser, corporate-finance adviser, Qualified Person or securities research provider in connection with this publication.
All model outputs are scenario-based and depend on the assumptions used. Actual results may differ materially from the scenarios presented. Commodity prices, costs, financing conditions, permitting timelines and project-development outcomes are uncertain and subject to change.
Stormlands Mining does not represent or warrant that the information or model outputs are complete, accurate or suitable for any particular purpose. Readers should treat this publication as one source of information only and conduct their own independent technical, financial, legal, tax and investment due diligence before making any decision.
Neither Stormlands Mining nor any of its directors, officers, employees or advisers accepts liability for any loss arising from reliance on this publication or the information contained in it.