
Kinsley Gold Project, Nevada, USA
Based on the NI 43-101 PEA NI 43-101 effective date 23 March 2026 and independent modelling by Stormlands Mining
Introduction
From Technical Report Data to Dynamic Project Valuation
Stormlands Mining analysed the July 2026 NI 43-101 Preliminary Economic Assessment for the Kinsley Gold Project in Nevada and converted the technical disclosure into a structured economic model.
Kinsley provides a useful example of how the Stormlands framework can extend the analysis contained in a published economic study.
The technical report already contains a Preliminary Economic Assessment, mine plan and discounted cash-flow model. Stormlands therefore used the underlying disclosure to construct an independent, standardised economic model, compare its outputs with the published PEA and then test how the project responds when key assumptions change.
The analysis begins with the US$3,200/oz gold price used in the PEA economic model. Stormlands then tests the project’s value drivers through sensitivity and heatmap analysis before updating the gold price to the June 2026 average of US$4,245.22/oz.
The result demonstrates the substantial effect that commodity-price assumptions can have on the valuation of a relatively short-life gold project.
At the PEA gold price, the Stormlands model produces a post-tax Project NPV of approximately US$41.6 million.
At the updated gold price, NPV increases to approximately US$122.7 million.
That represents an increase of approximately US$81.1 million, or 195%, despite the gold price itself increasing by only 32.7%.
Understanding why requires looking first at how the project was extracted and modelled.
From Technical Report to Structured Economic Model
Technical reports do not necessarily present all of the information required for economic modelling as a single set of standardised inputs.
Relevant data can be distributed across mine schedules, metallurgical sections, capital and operating-cost tables, economic assumptions and cash-flow schedules. Some values are explicitly stated, while others need to be calculated or standardised before they can be used consistently.
For Kinsley, Stormlands extracted and structured the principal inputs required to model the project, including:
- mine production;
- mineralised tonnes;
- gold grade;
- metallurgical recovery;
- gold price;
- operating expenditure;
- initial capital;
- refining and selling costs;
- taxation; and
- discount rate.
Where an input was not explicitly provided in the form required by the Stormlands model, it was derived from information disclosed elsewhere in the technical report or treated according to a standardised modelling protocol.
The objective is not simply to reproduce a published headline NPV.
It is to transform technical disclosure into structured data that can be independently interrogated.
Model Basis
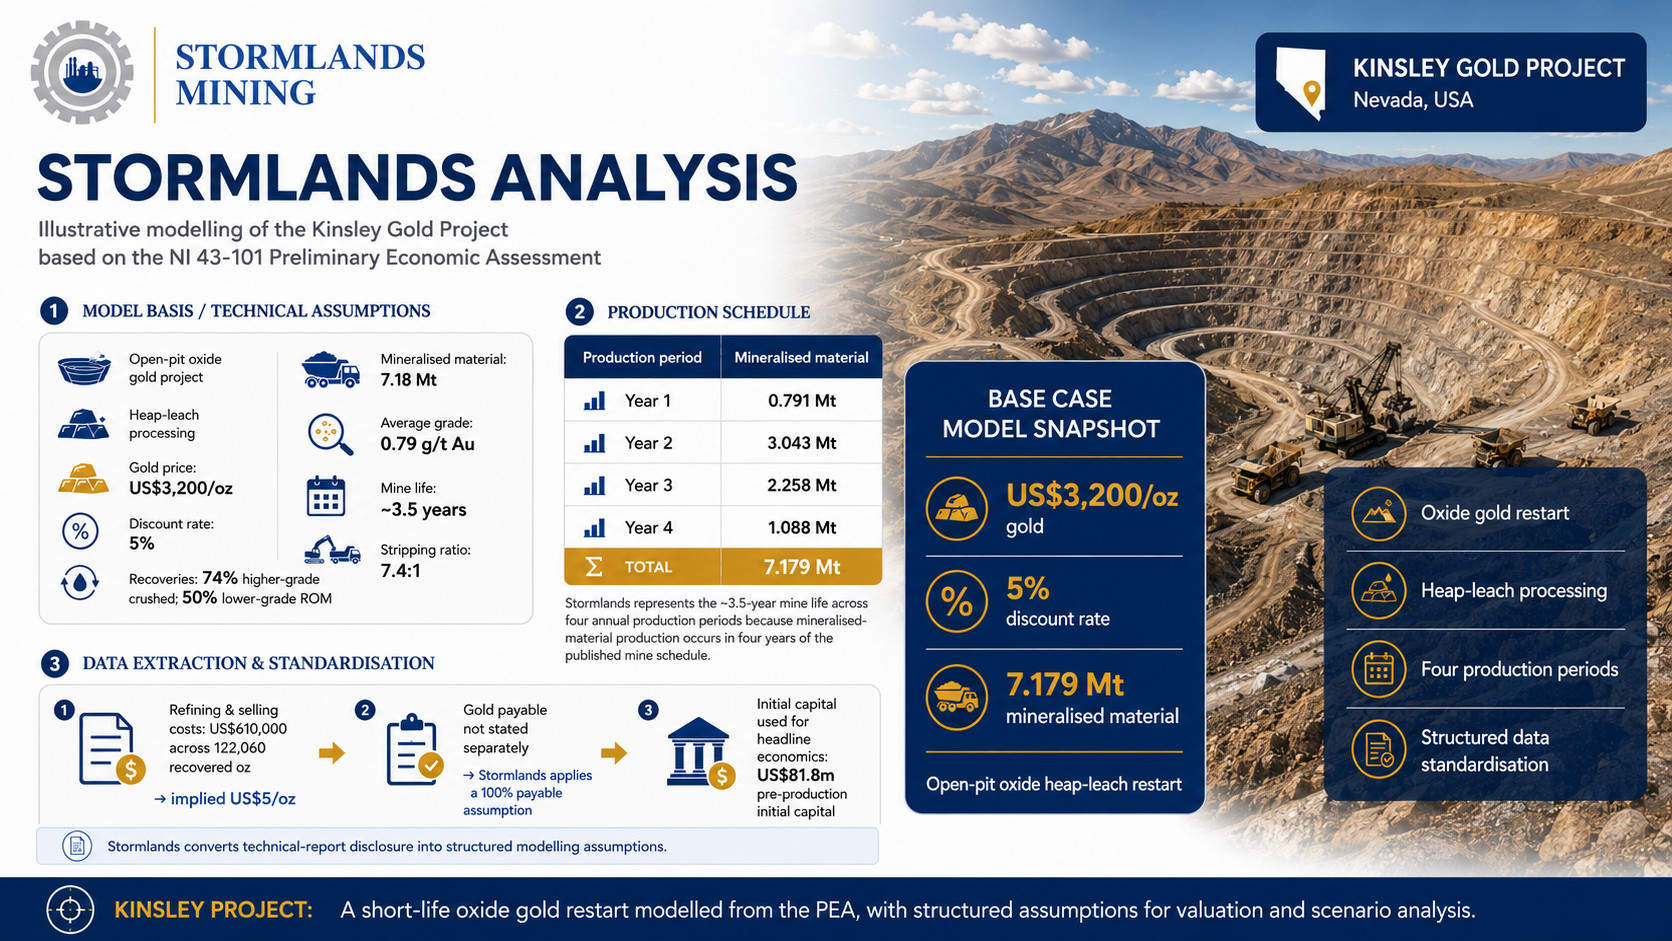
The Kinsley PEA evaluates a conventional open-pit operation processing oxide gold mineralisation through heap leaching.
The primary PEA economic model uses a flat gold price of US$3,200/oz and a 5% discount rate.
Higher-grade mineralised material is crushed before heap leaching, while lower-grade material is placed directly on the heap as run-of-mine material.
The economic assumptions apply gold recoveries of:
- 74% for higher-grade crushed material; and
- 50% for lower-grade ROM material.
The published mine schedule contains approximately 7.18 million tonnes of mineralised material at an average life-of-mine grade of approximately 0.79 g/t Au.
Stormlands represents production over four annual periods:
| Production period | Mineralised material |
| Year 1 | 0.791 Mt |
| Year 2 | 3.043 Mt |
| Year 3 | 2.258 Mt |
| Year 4 | 1.088 Mt |
| Total | 7.179 Mt |
The technical report describes an approximately 3.5-year mine life. Stormlands represents this across four annual production periods because mineralised-material production occurs in four years of the published mine schedule.
The mine plan also requires substantial waste movement relative to the amount of mineralised material processed, resulting in a life-of-mine stripping ratio of approximately 7.4:1.
This becomes important when assessing the project’s operating-cost sensitivity.
Data Extraction and standardisation
Some Kinsley inputs demonstrate why standardisation is an important part of the modelling process.
For example, the PEA does not state a standalone refining cost per ounce. Instead, the cash-flow schedule reports approximately US$610,000 of aggregate refining and selling costs against approximately 122,060 recovered ounces.
This allows an implied refining and selling cost of approximately US$5/oz to be derived.
Similarly, a separate gold payable percentage is not explicitly stated. Stormlands therefore applies its protocol for an unspecified payable percentage while separately recognising the disclosed refining and selling costs.
Capital disclosure also requires the distinction between different measures.
The PEA’s headline economic results identify US$81.8 million of initial capital. Other capital tables contain higher totals because they include expenditure incurred during the production period.
Stormlands uses the US$81.8 million pre-production initial capital requirement for the headline project economics.
These examples illustrate the distinction between extracting numbers from a report and converting technical disclosure into structured modelling assumptions.
Contained and Recovered Gold
The resulting physical model closely reproduces the PEA mine plan.
| Metric | Stormlands model |
| Modelled mine output | 7.179 Mt |
| Average gold grade | 0.79 g/t Au |
| Contained gold | 181,321 oz |
| Recovered gold | 122,089 oz |
| Payable gold | 122,089 oz |
| Implied LOM recovery | 67.3% |
The technical-report cash-flow analysis contains approximately 181,290 ounces of contained gold and approximately 122,060 recovered ounces.
Stormlands therefore reproduces both contained and recovered gold to within approximately 30 ounces over the life of the operation.
Across the mine life, approximately 181,000 contained ounces translate into approximately 122,000 recovered ounces, equivalent to an overall recovery of approximately 67%.
Annual recoveries do not necessarily correspond directly with the contained gold mined in the same year.
Kinsley is modelled as a heap-leach operation. Gold placed on the heap during one period can continue to be recovered in subsequent periods. The annual recovery profile therefore reflects the timing of both stacking and subsequent gold recovery.
This is an example of why modelling the relationship between technical inputs matters. An annual recovery percentage viewed in isolation can give a misleading impression of the underlying process.
Establishing the Report-Based Economic Case
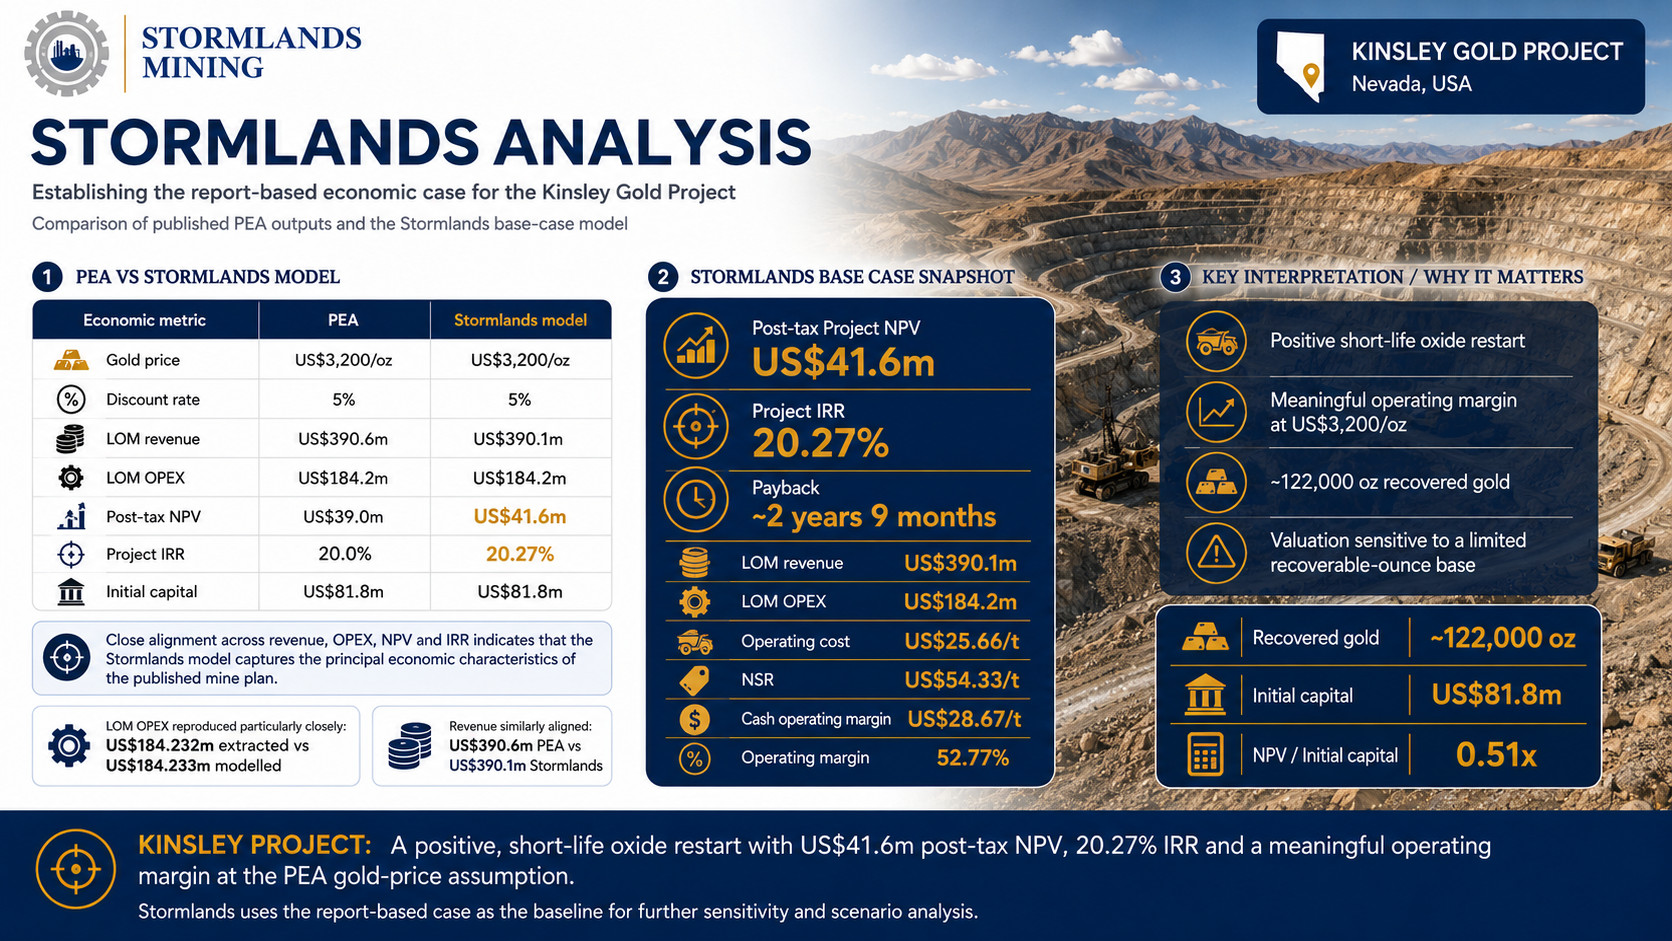
Stormlands compared the principal outputs of its model with those reported in the PEA.
| Economic metric | PEA | Stormlands model |
| Gold price | US$3,200/oz | US$3,200/oz |
| Discount rate | 5% | 5% |
| LOM revenue | US$390.6m | US$390.1m |
| LOM OPEX | US$184.2m | US$184.2m |
| Post-tax NPV | US$39.0m | US$41.6m |
| Project IRR | 20.0% | 20.27% |
| Initial capital | US$81.8m | US$81.8m |
Operating expenditure is reproduced particularly closely.
The technical-report extraction identifies approximately US$184.232 million of life-of-mine OPEX. Stormlands calculates approximately US$184.233 million.
Revenue is similarly aligned, at approximately US$390.6 million in the PEA and US$390.1 million in the Stormlands model.
At the valuation level, the PEA reports a post-tax NPV of approximately US$39.0 million and IRR of 20%.
Stormlands produces a post-tax Project NPV of approximately US$41.6 million and Project IRR of 20.27%.
The purpose is not to force every Stormlands output to equal the published PEA exactly.
Stormlands is building a standardised economic model from the technical disclosure. The close alignment of production, contained metal, recovered metal, revenue, operating expenditure and headline economic returns indicates that the model captures the principal economic characteristics of the published mine plan.
It also establishes the baseline required for further analysis.
Stormlands Base Case
Using the US$3,200/oz gold price applied in the PEA, the Stormlands model produces:
- Post-tax Project NPV: US$41.6 million
- Project IRR: 20.27%
- Payback: approximately 2 years and 9 months
- Life-of-mine revenue: US$390.1 million
- Life-of-mine operating expenditure: US$184.2 million
- Operating cost: US$25.66/t
- Net smelter return: US$54.33/t
- Cash operating margin: US$28.67/t
- Operating margin: 52.77%
The project therefore generates a meaningful operating margin at the PEA gold-price assumption.
However, the scale of the current economic plan is relatively compact.
Approximately 122,000 ounces of gold are recovered, against initial capital of US$81.8 million.
The Stormlands NPV of US$41.6 million is equivalent to approximately 0.51 times initial capital.
Kinsley therefore presents at US$3,200/oz as a positive, short-life oxide restart whose valuation is particularly sensitive to the assumptions applied to a relatively limited recoverable-ounce base.
Value Drivers and Stormlands Sensitivity Analysis
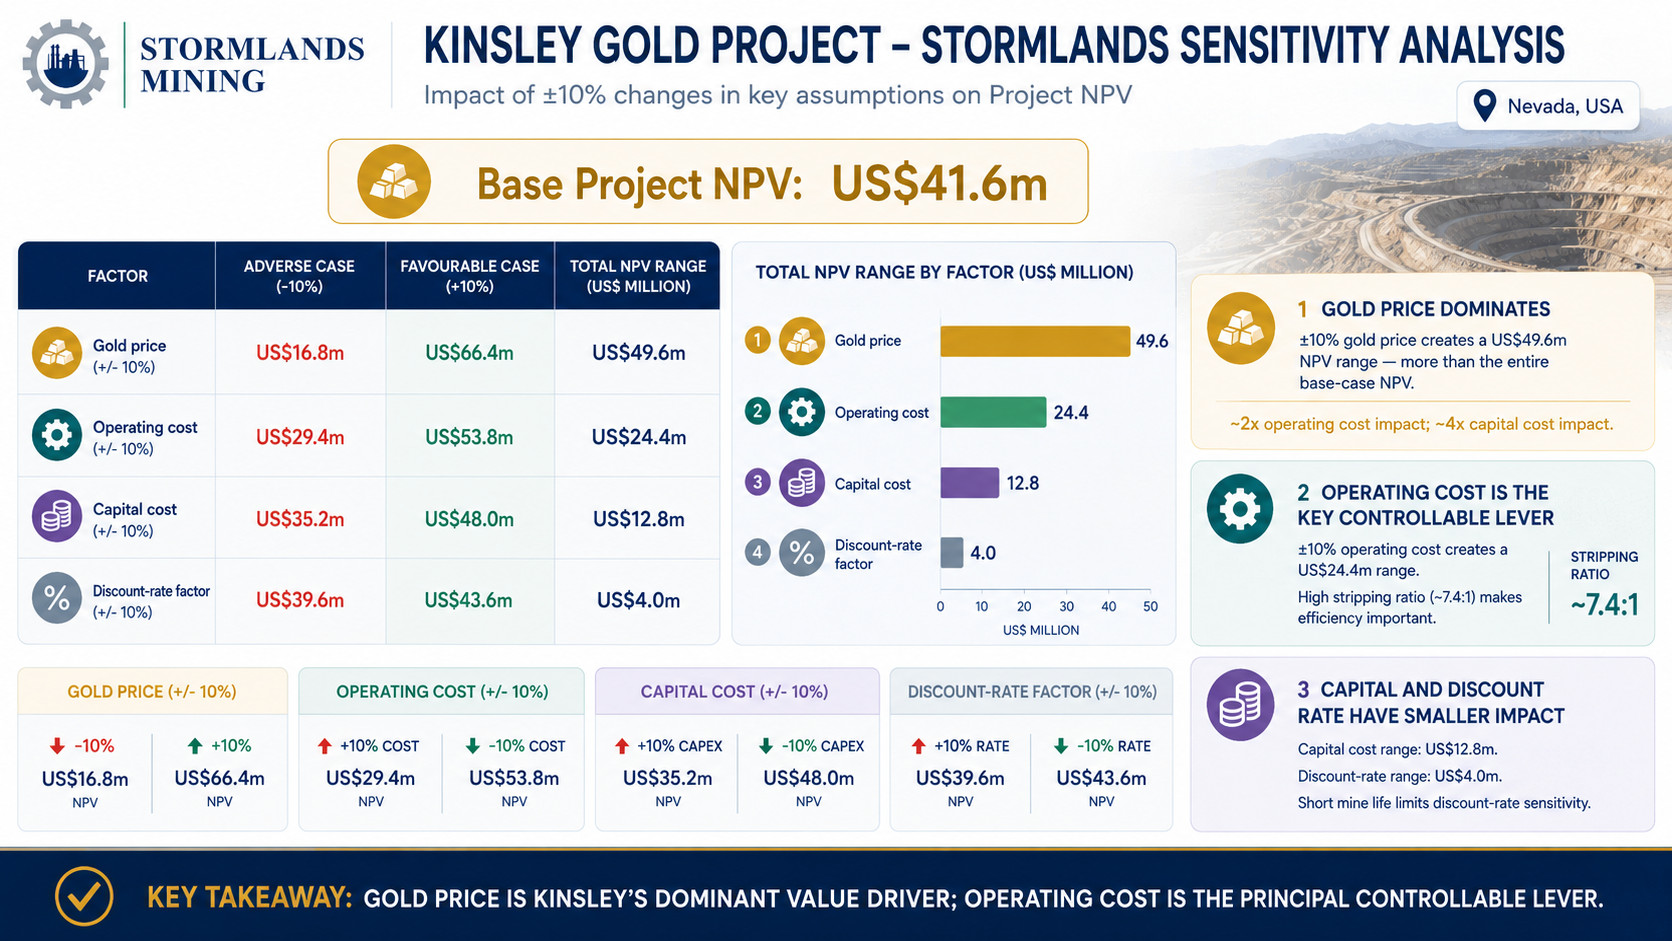
Stormlands tested the effect of independently changing the principal economic assumptions by ±10%, starting from the US$41.6 million base Project NPV.
| Factor | Adverse case NPV | Favourable case NPV | Total NPV range |
| Gold price (+/- 10%) | US$16.8m | US$66.4m | US$49.6m |
| Operating cost (+/- 10%) | US$29.4m | US$53.8m | US$24.4m |
| Capital cost (+/- 10%) | US$35.2m | US$48.0m | US$12.8m |
| Discount-rate factor (+/- 10%) | US$39.6m | US$43.6m | US$4.0m |
The analysis shows a clear hierarchy.
- Gold price is the dominant value driver.
- Operating cost is the most significant controllable value driver.
- Capital cost has a materially smaller impact within the tested range.
- Discount-rate sensitivity is comparatively limited.
Gold Price Dominates Project Value
- A 10% decrease in gold price reduces Project NPV from US$41.6 million to approximately US$16.8 million.
- A 10% increase raises NPV to approximately US$66.4 million.
- A ±10% movement in gold price therefore creates a total NPV range of approximately US$49.6 million.
- That is more than the entire base-case Project NPV.
- The movement on either side of the base case is approximately US$24.8 million, equivalent to almost 60% of the starting NPV.
- Gold-price sensitivity is approximately twice the impact of operating cost and almost four times the impact of capital cost within the same ±10% test.
Kinsley is therefore highly leveraged to gold price.
Operating Cost is the Principal Controllable Driver
- A 10% increase in operating cost reduces Project NPV to approximately US$29.4 million.
- A 10% reduction raises NPV to approximately US$53.8 million.
- This produces a total valuation range of approximately US$24.4 million.
- The physical mine plan helps explain why cost control matters.
- With a stripping ratio of approximately 7.4:1, substantially more waste must be moved than mineralised material processed.
- Mining productivity, haulage, fuel, labour and other recurring operating costs can therefore have a meaningful effect on project value.
- Unlike gold price, many of these factors are at least partly within the control of the operator.
- Operating efficiency is therefore Kinsley’s most important controllable economic lever.
Capital and Discount-Rate Sensitivity
- Capital cost has a smaller impact than either gold price or operating cost.
- A 10% increase reduces Project NPV to approximately US$35.2 million, while a 10% reduction increases it to approximately US$48.0 million.
- The corresponding total range is approximately US$12.8 million.
- Discount-rate sensitivity is smaller again.
- Across the ±10% discount-rate-factor test, Project NPV ranges only from approximately US$39.6 million to US$43.6 million.
This reflects Kinsley’s short economic life.
A substantial proportion of the project’s cash flow occurs relatively early, so comparatively little value depends on cash flows many years into the future.
Stormlands Heatmap Analysis
The sensitivity analysis changes each variable independently.
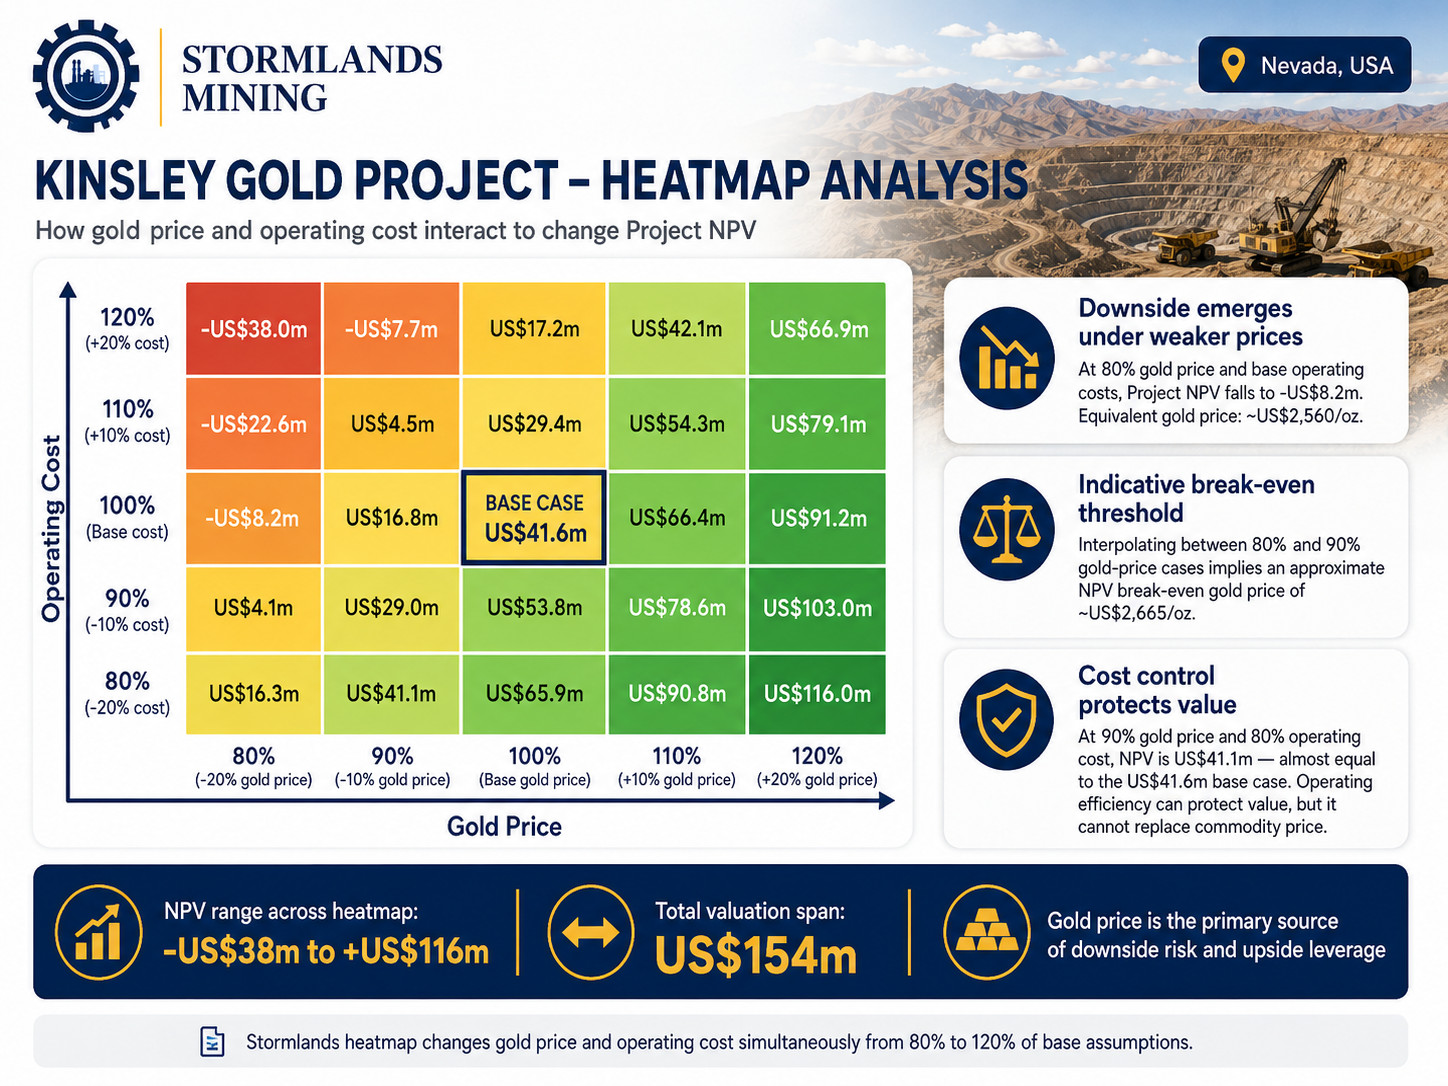
Stormlands’ heatmap provides a more demanding test by changing gold price and operating cost simultaneously, from 80% to 120% of their respective base assumptions.
At the centre of the heatmap, both assumptions remain at 100%, producing the base Project NPV of US$41.6 million.
Selected scenarios demonstrate the range of outcomes:
| Gold price | Operating cost | Project NPV |
| 80% | 120% | -US$38.0m |
| 90% | 110% | US$4.5m |
| 100% | 100% | US$41.6m |
| 110% | 120% | US$42.1m |
| 90% | 80% | US$41.1m |
| 120% | 100% | US$91.2m |
| 120% | 80% | US$116.0m |
Across the heatmap, Project NPV ranges from approximately negative US$38 million to positive US$116 million.
That is a valuation span of approximately US$154 million around a base-case project worth US$41.6 million.
The heatmap reinforces the conclusion from the sensitivity analysis: gold price is the primary source of both downside risk and upside leverage, while operating-cost performance can materially strengthen or weaken the project’s resilience.
Where Does the Downside Emerge?
- At 80% of the base gold price and base operating costs, Project NPV falls to approximately negative US$8.2 million.
- The equivalent gold price is approximately US$2,560/oz.
- At 90% of the base gold price, or approximately US$2,880/oz, NPV remains positive at base operating costs, at approximately US$16.8 million.
- Interpolating between those scenarios indicates an approximate NPV break-even gold price of around US$2,665/oz in the Stormlands model.
This is an indicative modelled threshold rather than a formal project break-even price.
Operating-cost inflation increases the downside.
At 80% gold price and 120% operating cost, Project NPV falls to approximately negative US$38 million.
Kinsley therefore retains some resilience to moderate gold-price weakness, but the margin of safety reduces quickly when weaker prices coincide with higher costs.
Cost Control Can Protect Value
The heatmap also demonstrates the value of operating efficiency.
- At 90% of the base gold price and 80% of base operating cost, Project NPV is approximately US$41.1 million.
- That is almost identical to the US$41.6 million base case.
- Within the model, a 20% reduction in operating costs therefore almost completely offsets a 10% decline in gold price.
- At the same 90% gold-price assumption but with operating costs at 110% of base, NPV falls to approximately US$4.5 million.
Operating performance can therefore materially alter the outcome under the same commodity-price environment.
However, cost reductions cannot fully compensate for increasingly large gold-price declines.
At 80% of the base gold price and 80% operating costs, NPV remains positive at approximately US$16.3 million, but remains substantially below the base-case valuation.
Operating efficiency can protect value.
It cannot replace commodity price.
Current Gold Price Scenario
The sensitivity and heatmap analyses establish gold price as Kinsley’s dominant value driver.
Stormlands then tested that finding directly by updating the PEA gold-price assumption.
The technical-report economic model uses US$3,200/oz.
Stormlands’ updated scenario uses the June 2026 average gold price of US$4,245.22/oz.
This is an increase of approximately 32.7%.
The underlying mine plan is unchanged.
Stormlands holds constant:
- ore tonnes;
- gold grade;
- metallurgical recovery;
- operating expenditure;
- initial capital; and
- discount rate.
The updated scenario therefore isolates the effect of commodity price on the existing project.
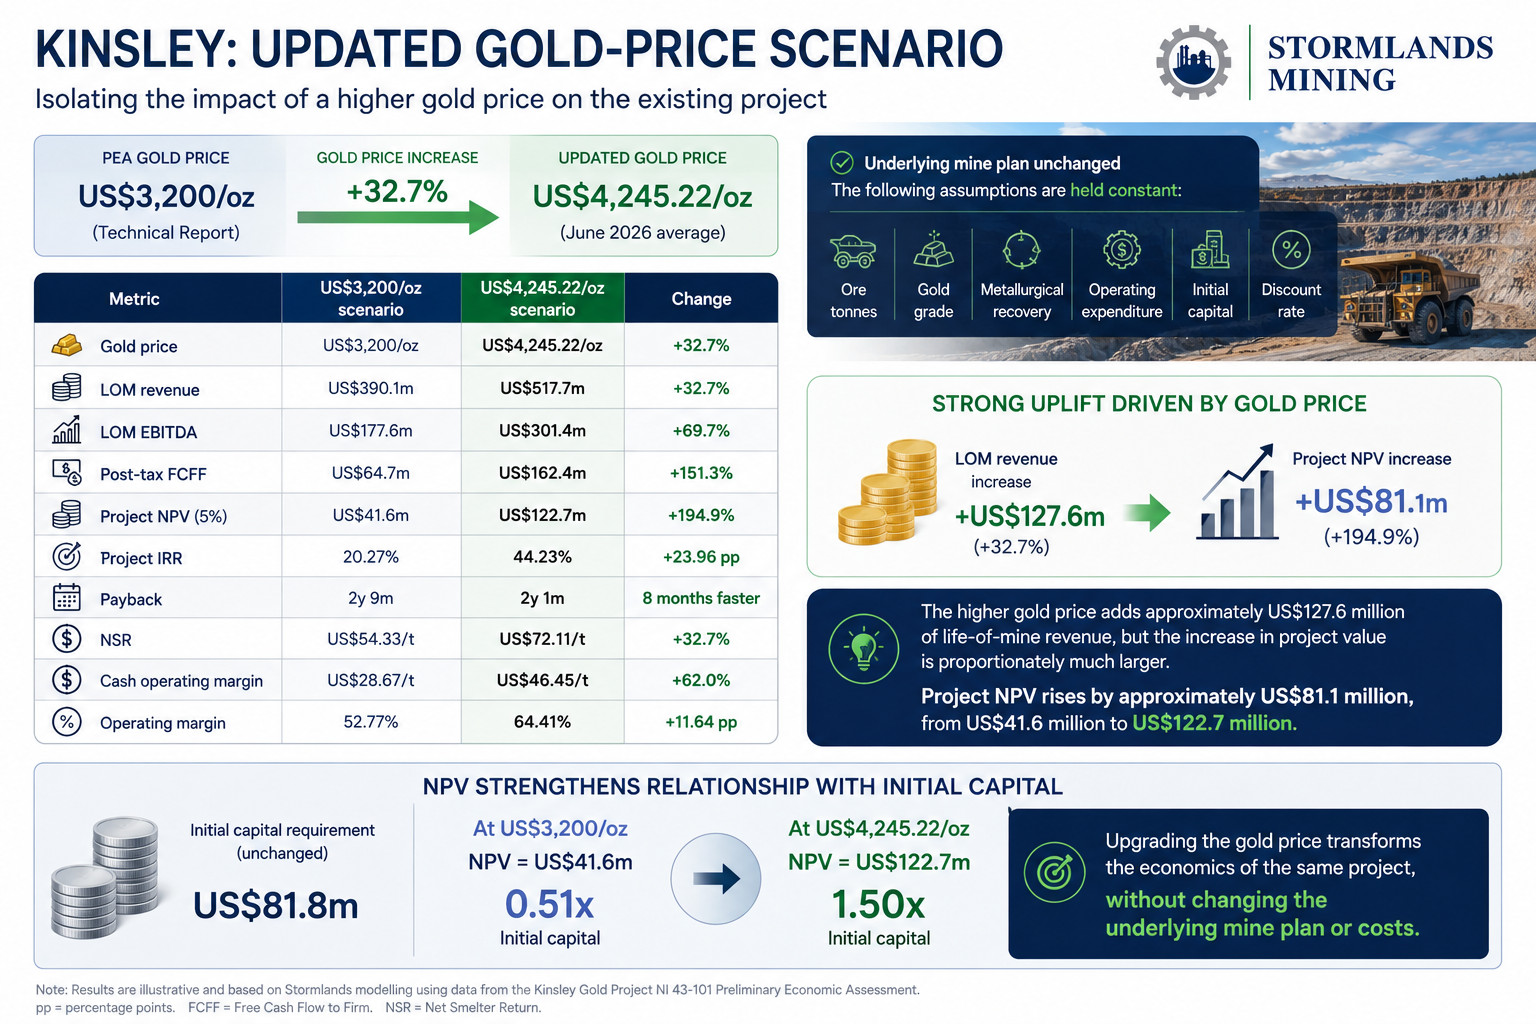
The result is substantial.
| Metric | US$3,200/oz scenario | US$4,245.22/oz scenario | Change |
| Gold price | US$3,200/oz | US$4,245.22/oz | +32.7% |
| LOM revenue | US$390.1m | US$517.7m | +32.7% |
| LOM EBITDA | US$177.6m | US$301.4m | +69.7% |
| Post-tax FCFF | US$64.7m | US$162.4m | +151.3% |
| Project NPV | US$41.6m | US$122.7m | +194.9% |
| Project IRR | 20.27% | 44.23% | +23.96 percentage points |
| Payback | 2y 9m | 2y 1m | 8 months faster |
| NSR | US$54.33/t | US$72.11/t | +32.7% |
| Cash operating margin | US$28.67/t | US$46.45/t | +62.0% |
| Operating margin | 52.77% | 64.41% | +11.64 percentage points |
The gold-price increase adds approximately US$127.6 million of life-of-mine revenue.
But the increase in project value is proportionately much larger.
Project NPV rises by approximately US$81.1 million, from US$41.6 million to US$122.7 million.
The project therefore moves from an NPV equivalent to approximately 0.51 times initial capital to approximately 1.50 times initial capital.
Why Does a 33 Percent Increase Almost Triple NPV
At first sight, a 32.7% increase in gold price producing an approximately 195% increase in NPV appears disproportionate.
The model explains why.
- Most of the project’s physical and operating assumptions do not change when the gold price changes.
- The operation still processes approximately 7.18 Mt.
- It still recovers approximately 122,000 ounces.
- Initial capital remains US$81.8 million.
- Life-of-mine OPEX remains approximately US$184.2 million.
- The higher commodity price therefore increases revenue without requiring a corresponding increase in the underlying mine plan or operating-cost base.
- Revenue increases by approximately US$127.6 million.
- EBITDA increases by approximately US$123.8 million.
- Approximately 97% of the incremental revenue therefore flows through to incremental EBITDA in the Stormlands model.
- After taxation and other deductions, post-tax FCFF increases by approximately US$97.8 million.
- The result is an additional approximately US$81.1 million of discounted Project NPV.
Kinsley therefore exhibits significant operating leverage to gold price.
The Starting Valuation also Matters
The percentage uplift is amplified by the relatively modest starting NPV.
At US$3,200/oz, Project NPV is only US$41.6 million.
Adding approximately US$81.1 million of value to that relatively small starting number produces an increase of approximately 195%.
The same absolute increase applied to a project with a much larger starting NPV would produce a far smaller percentage change.
Kinsley’s strong percentage uplift therefore reflects both:
- the amount of additional cash flow generated by the higher gold price; and
- the relatively small NPV from which the project starts.
This is an important distinction.
The updated scenario is not evidence of an unusually nonlinear model.
It is the consequence of substantial commodity-price leverage acting on a relatively modest base valuation.
The Stormlands Sensitivity Analysis Anticipated the Result
The updated valuation is also consistent with the earlier Stormlands sensitivity analysis.
A 10% increase in gold price raised Project NPV by approximately US$24.8 million in the sensitivity model.
The June 2026 gold price is approximately 32.7% above the PEA price.
Scaling the sensitivity response to that price movement implies approximately US$81 million of additional NPV.
The actual updated-price model generates an uplift of approximately US$81.1 million.
The updated commodity-price result therefore confirms, rather than contradicts, the sensitivity analysis.
Gold price was identified as Kinsley’s dominant value driver before the updated scenario was run.
The updated DCF demonstrates the magnitude of that leverage when the price movement extends beyond the ±10% sensitivity range.
Short mine-Life Strengthens the Uplift
Kinsley’s short operating life also contributes to the result.
The mine plan is represented across four annual production periods.
Incremental revenue generated by a higher gold price therefore occurs relatively early in the project life rather than being spread over a decade or more.
These additional cash flows are subject to relatively limited discounting.
This is consistent with the earlier sensitivity analysis, which found that changes to the discount-rate factor had comparatively little impact on NPV.
Kinsley therefore combines:
- strong commodity-price sensitivity;
- a largely unchanged cost base under the price scenario; and
- a short cash-flow duration.
Together, these characteristics create substantial leverage to higher gold prices.
The Margin of Safety Changes Materially
The updated gold-price scenario does more than increase headline NPV.
It changes the financial character of the project.
At US$3,200/oz:
- Project NPV is US$41.6 million;
- Project IRR is 20.27%;
- payback is approximately 33 months; and
- cash operating margin is US$28.67/t.
At US$4,245.22/oz:
- Project NPV increases to US$122.7 million;
- Project IRR increases to 44.23%;
- payback falls to approximately 25 months; and
- cash operating margin rises to US$46.45/t.
The operating margin increases from 52.77% to 64.41%.
The updated scenario therefore does not simply create a larger NPV.
It increases the project’s capacity to absorb adverse movements in other assumptions and materially strengthens the relationship between project value and the initial capital requirement.
The Current Economic Plan Represents Only Part of Kinsley
The economic analysis also needs to be considered in the context of the wider Mineral Resource.
The 2026 Mineral Resource Estimate reports approximately:
- 742,000 ounces of gold in the Indicated category; and
- 69,000 ounces in the Inferred category.
This represents approximately 811,000 ounces of gold in total.
The oxide resource contains approximately 202,000 ounces, comprising 193,000 Indicated ounces and 9,000 Inferred ounces.
The current mine plan contains approximately 181,000 ounces.
It therefore captures approximately 90% of the reported oxide ounces, but only around 22% of the total current Mineral Resource ounces.
The PEA is principally an economic assessment of an open-pit oxide heap-leach restart.
It is not an economic valuation of the entire Kinsley Mineral Resource.
The wider resource also contains approximately:
- 384,000 Indicated and 27,000 Inferred ounces of Secret Canyon sulfide gold; and
- 164,000 Indicated and 33,000 Inferred ounces of other sulfide gold.
These resources require different processing considerations and are not part of the current oxide heap-leach economic plan.
This creates a separate source of potential project optionality from the commodity-price leverage demonstrated by the Stormlands model.
Stormlands Interpretation
The Kinsley analysis illustrates why a single headline NPV provides only a partial view of a project’s economics.
Using the US$3,200/oz gold price in the PEA, Stormlands reproduces a positive but relatively modest economic case:
US$41.6 million Project NPV, 20.27% IRR and approximately 33-month payback.
The sensitivity analysis then identifies gold price as the overwhelming value driver.
A ±10% change in gold price moves NPV between approximately US$16.8 million and US$66.4 million.
The heatmap shows that operating-cost performance can materially protect or weaken the project, but commodity price ultimately dominates the valuation.
Updating the gold price to the June 2026 average demonstrates that leverage directly.
A 32.7% increase in gold price increases Project NPV by approximately 195%, from US$41.6 million to US$122.7 million.
IRR more than doubles to 44.23%, while payback shortens by approximately eight months.
The apparently disproportionate NPV uplift is explained by the project’s operating leverage.
The higher gold price increases revenue while the physical mine plan, production profile, initial capital and operating-cost base remain unchanged. Much of the incremental revenue consequently passes through to project cash flow.
Kinsley’s relatively small starting NPV magnifies the percentage increase, while its short mine life means the additional cash flows are not heavily discounted.
The updated scenario therefore does not represent a change in the underlying resource, geology or mine plan.
It demonstrates how significantly the economic interpretation of the same project can change when the commodity-price assumption changes.
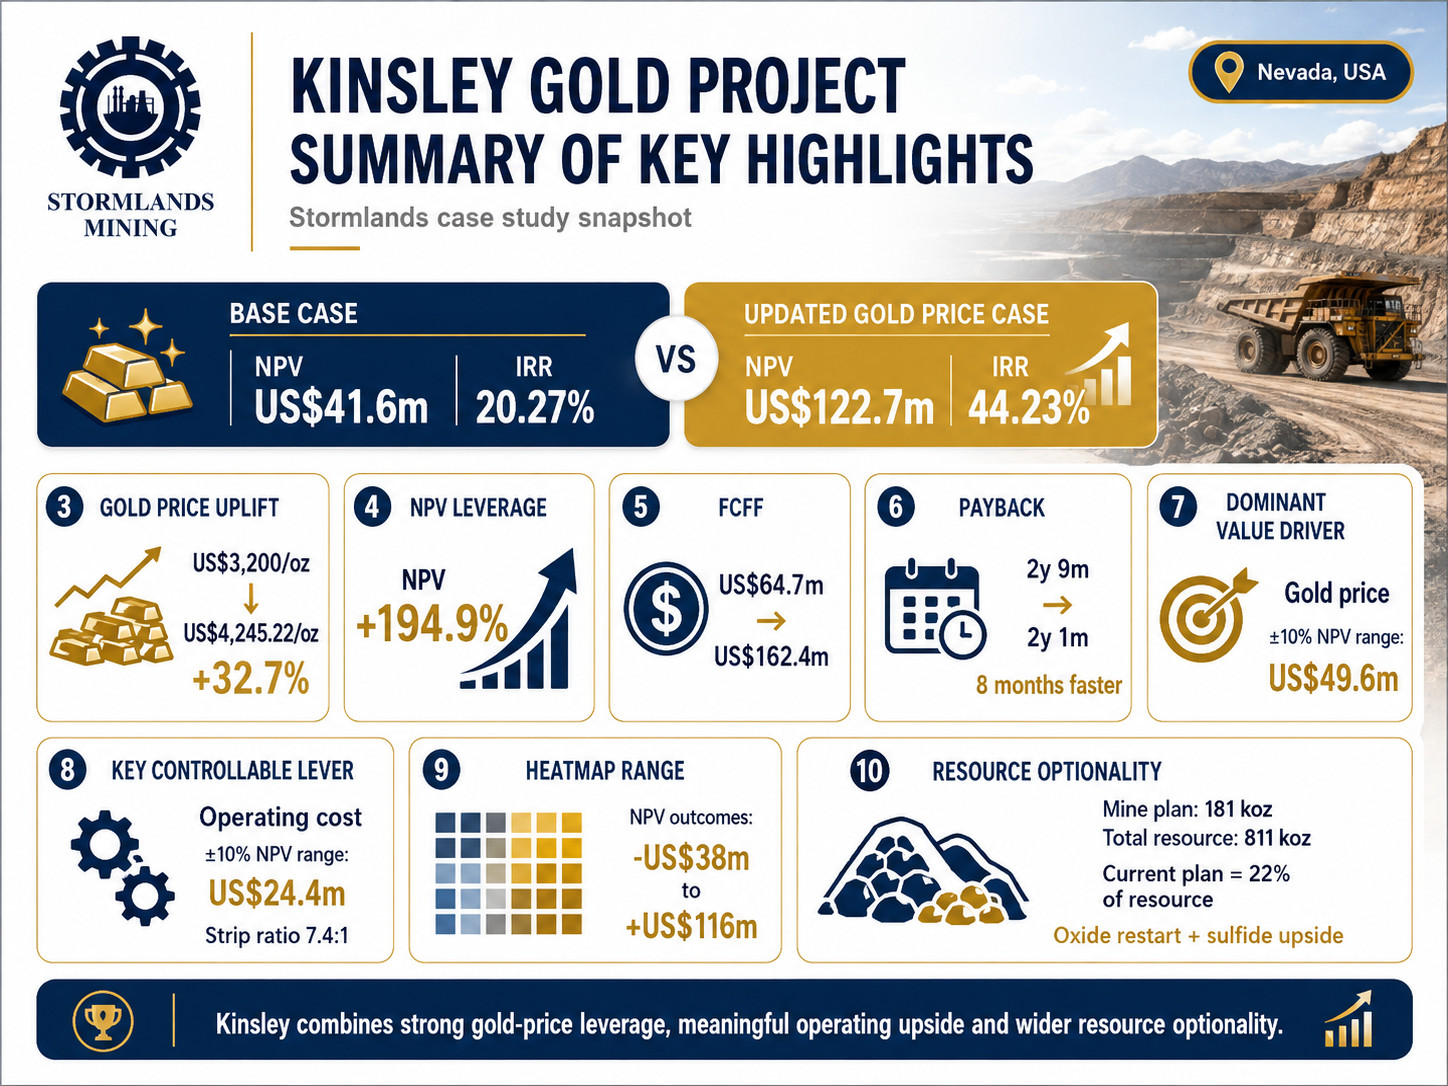
Summary of Key Highlights
- Stormlands base case: At the PEA gold price of US$3,200/oz, the model produces a post-tax Project NPV of US$41.6m and IRR of 20.27%.
- Updated gold-price case: Using the June 2026 average of US$4,245.22/oz, Project NPV increases to US$122.7m and IRR to 44.23%.
- Strong commodity-price leverage: A 32.7% increase in gold price drives a 194.9% increase in Project NPV.
- Cash flow strengthens materially: Post-tax Project FCFF rises from US$64.7m to US$162.4m, while EBITDA increases from US$177.6m to US$301.4m.
- Faster capital recovery: Modelled payback improves from approximately 2 years 9 months to 2 years 1 month under the updated-price scenario.
- Gold price is the dominant value driver: A ±10% gold-price change produces an NPV range of US$49.6m, roughly twice the impact of operating cost.
- Operating cost is the key controllable lever: A ±10% operating-cost change produces an NPV range of US$24.4m, supported by a relatively high 7.4:1 stripping ratio.
- Wide range of possible outcomes: The heatmap produces Project NPVs from approximately negative US$38m to positive US$116m, depending on combined gold-price and operating-cost assumptions.
- Current economics cover only part of Kinsley: The PEA mine plan contains approximately 181,000 oz of gold, around 22% of the wider 811,000 oz Mineral Resource.
- Two distinct sources of optionality: Kinsley combines strong gold-price leverage within the current oxide restart with a materially larger sulfide resource outside the existing heap-leach economic plan.
Conclusion
Stormlands’ illustrative analysis of the Kinsley Gold Project shows a short-life oxide gold restart with positive economics at the gold price used in the July 2026 PEA and substantial leverage to a higher gold-price environment.
Using the PEA’s US$3,200/oz gold price, the Stormlands model produces a post-tax Project NPV of approximately US$41.6 million, Project IRR of 20.27% and payback of approximately 2 years and 9 months.
The sensitivity analysis identifies gold price as the dominant value driver, with operating cost the most important controllable variable.
When the gold-price assumption is updated to the June 2026 average of US$4,245.22/oz, the same underlying project produces a post-tax Project NPV of approximately US$122.7 million, Project IRR of 44.23% and payback of approximately 2 years and 1 month.
The updated gold price is 32.7% above the PEA assumption, but modelled NPV increases by approximately 195%.
This leverage reflects Kinsley’s relatively fixed cost structure, small starting NPV and short mine life. Incremental gold revenue flows disproportionately into project cash flow because the underlying production and cost assumptions remain unchanged.
At the same time, the current economic model considers principally the oxide restart. The mine plan contains approximately 181,000 ounces of gold compared with approximately 811,000 ounces in the wider 2026 Mineral Resource, leaving substantial sulfide mineralisation outside the current economic plan.
The analysis therefore identifies two distinct dimensions of potential value at Kinsley:
- significant leverage of the existing oxide mine plan to gold price, and
- a larger Mineral Resource opportunity beyond the ounces currently included in the PEA economic case.
Stormlands’ analysis is illustrative and is based on information contained in the Kinsley Project NI 43-101 Technical Report and assumptions derived from that disclosure. It is not a feasibility study, Mineral Reserve estimate or investment recommendation.
About Stormlands
Stormlands Mining is an AI-first valuation and analytics platform for mining assets and critical minerals. The platform helps users turn technical disclosures into interactive valuation models in minutes, rather than days or weeks. The valuation models are accessible over multiple platforms to all users, enabling the user to interact directly with the data to facilitate scenario-planning.
The platform enables users to build discounted cash flow models at scale, test commodity price, capex, opex, tax, royalty rates, discount-rates and production scenarios, and compare opportunities and scenarios.
Stormlands is using this technology to build the Stormlands Library: a global repository of mining asset valuation models. It has moved beyond a tool for analysts building individual models and is developing a data layer for the mining industry: a structured source of valuation models and illustrative scenarios. This creates a new way for investors, corporates, professional advisers, financial-market users and public-policy stakeholders to screen assets, benchmark projects and understand the key drivers of mining asset economics.
If you are interested in accessing the models in the library, email ceo@stormlandsmining.com
Important Notice
This analysis has been prepared by Stormlands Mining using publicly available information from the NI 43-101 Technical Report together with Stormlands’ own independent modelling assumptions.
The analysis is illustrative only. It is not a Preliminary Economic Assessment, Pre-Feasibility Study, Feasibility Study, Mineral Reserve estimate or independent technical report. It has not been prepared on behalf of the project owner and has not been reviewed or approved by the project owner.
The model outputs are Stormlands-generated illustrative estimates only. They should not be interpreted as demonstrated economic viability. Future technical work, including mine planning, metallurgical testing, engineering, environmental studies, permitting, capital-cost estimation and operating-cost estimation, would be required before any formal economic conclusions could be drawn.