
Fremont Gold Property, Mariposa County, California, USA
Based on the 2026 NI 43-101 Mineral Resource Estimate and independent modelling by Stormlands Mining
Introduction
Stormlands Mining’s independent analysis of the Fremont Gold Property demonstrates how the technical and economic assumptions contained in a Mineral Resource technical report can be converted into an illustrative valuation model.
The Fremont Gold Property is located in Mariposa County, California, approximately 20 Km northwest of the town of Mariposa and 241 Km east of San Francisco. The project lies at the southern end of California’s historic Mother Lode Gold Belt and is owned 100% by Fremont Gold Mining LLC, a wholly owned subsidiary of Lode Gold Resources Inc.
The 2026 NI 43-101 Technical Report provides an updated Mineral Resource Estimate. It does not publish current project economics equivalent to a formal Preliminary Economic Assessment. The technical report recommends further PEA-level work to evaluate the potential economic viability of an underground mining and processing operation.
Stormlands modelled the project using the data from the updated Mineral Resource Estimate technical report creating a base case valuation model of the project. It uses the 20 million-tonne Indicated Mineral Resource, the US$3,515/oz gold price and the principal operating assumptions used in the technical report’s assessment of reasonable prospects for eventual economic extraction.
Stormlands then created a second scenario, keeping the same resource, grade, recovery, production rate, capital cost, operating cost and discount rate, but updating the gold price to US$4,245.22/oz (average of March 2026).
The comparison therefore isolates Fremont’s economic leverage to gold price. It does not assume a larger mine, higher grade, increased throughput, improved recovery or lower costs.
Project context
Mineral Resource Estimate
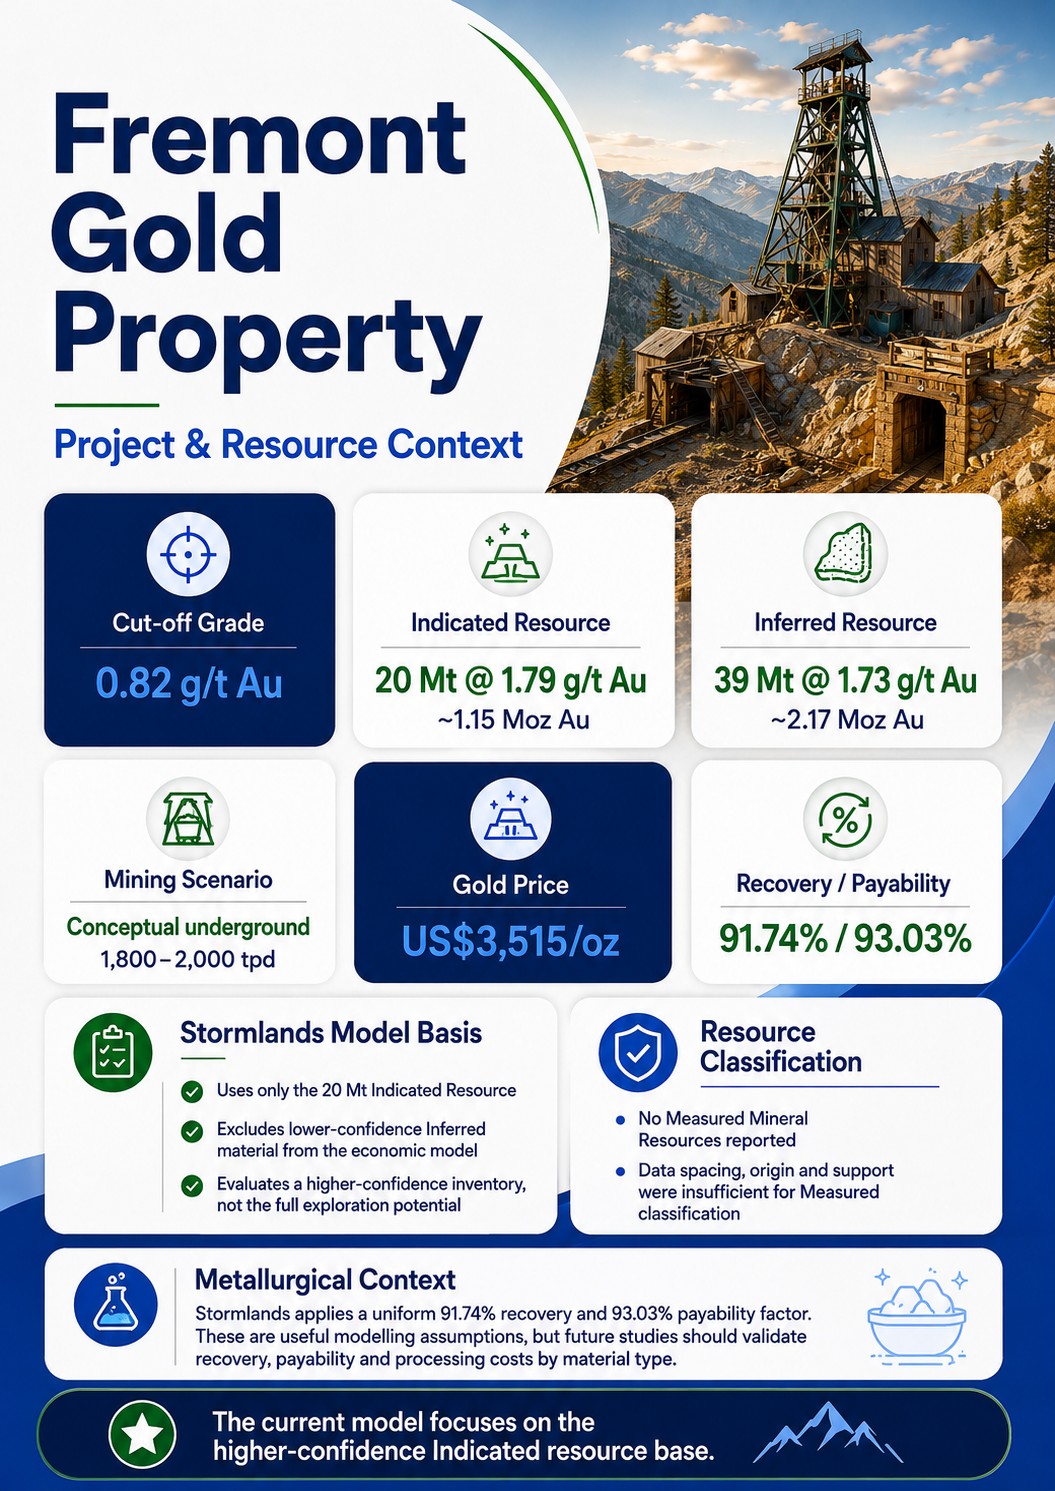
At a cut-off grade of 0.82 g/t Au, the 2026 technical report states:
- Indicated Mineral Resource: 20 Mt grading 1.79 g/t Au for approximately 1.15 Moz of gold.
- Inferred Mineral Resource: 39 Mt grading 1.73 g/t Au for approximately 2.17 Moz of gold.
The Mineral Resource was constrained using a conceptual underground scenario with processing capacity between approximately 1,800 and 2,000 tonnes per day. The report applied a gold price of US$3,515/oz, metallurgical recovery of 91.74% and a payability factor of 93.03%.
The Stormlands model uses only the 20 Mt Indicated Mineral Resource. It does not rely on the 39 Mt of lower-confidence Inferred material. The current model therefore evaluates a defined higher-confidence inventory but does not reflect the project’s complete reported resource base or wider exploration potential.
No Measured Mineral Resources are reported. The technical report states that data spacing, origin and support were not sufficient to support a Measured classification. It also notes that the Inferred category represents a significant proportion of the overall resource inventory.
Metallurgical Context
The Stormlands model applies a uniform 91.74% recovery and 93.03% payability factor. These are useful modelling assumptions, but a future study should validate recovery, payability and processing costs by material type.
Model Basis
Physical and Production Assumptions
| Assumption | Stormlands Model |
| Indicated resource tonnage used | 20.0 Mt |
| Gold grade | 1.79 g/t Au |
| Modelled mine output | Approximately 20.0 Mt |
| Contained gold | 1.151 Moz |
| Metallurgical recovery | 91.74% |
| Recovered gold | 1.056 Moz |
| Payability | 93.03% |
| Payable gold | Approximately 982,000 oz |
| Processing rate | Approximately 730,000 tpa |
| Daily processing rate | Approximately 2,000 tpd |
| Mine life | 27.4 years |
Economic Assumptions
| Assumption | Stormlands Model |
| Gold price – report-based case | US$3,515/oz |
| Gold price – updated case | US$4,245.22/oz |
| Operating cost | US$78.73/t |
| Initial capital | US$350.0m |
| Life-of-mine sustaining capital | Approximately US$297.4m |
| Total life-of-mine capital | US$647.4m |
| Initial working capital | US$9.5m |
| Discount rate | 5% |
| Third-party NSR | 3% |
| Modelled corporate income-tax rate | Approximately 28% |
Approximately 27 full production years process 730,000 tonnes annually, followed by a final partial year. During a normal full production year, the model produces approximately 42,000 contained ounces, 38,500 recovered ounces and 35,850 payable ounces. The updated scenario changes only the gold price. The physical plan and cost base remain unchanged.
Key Highlights
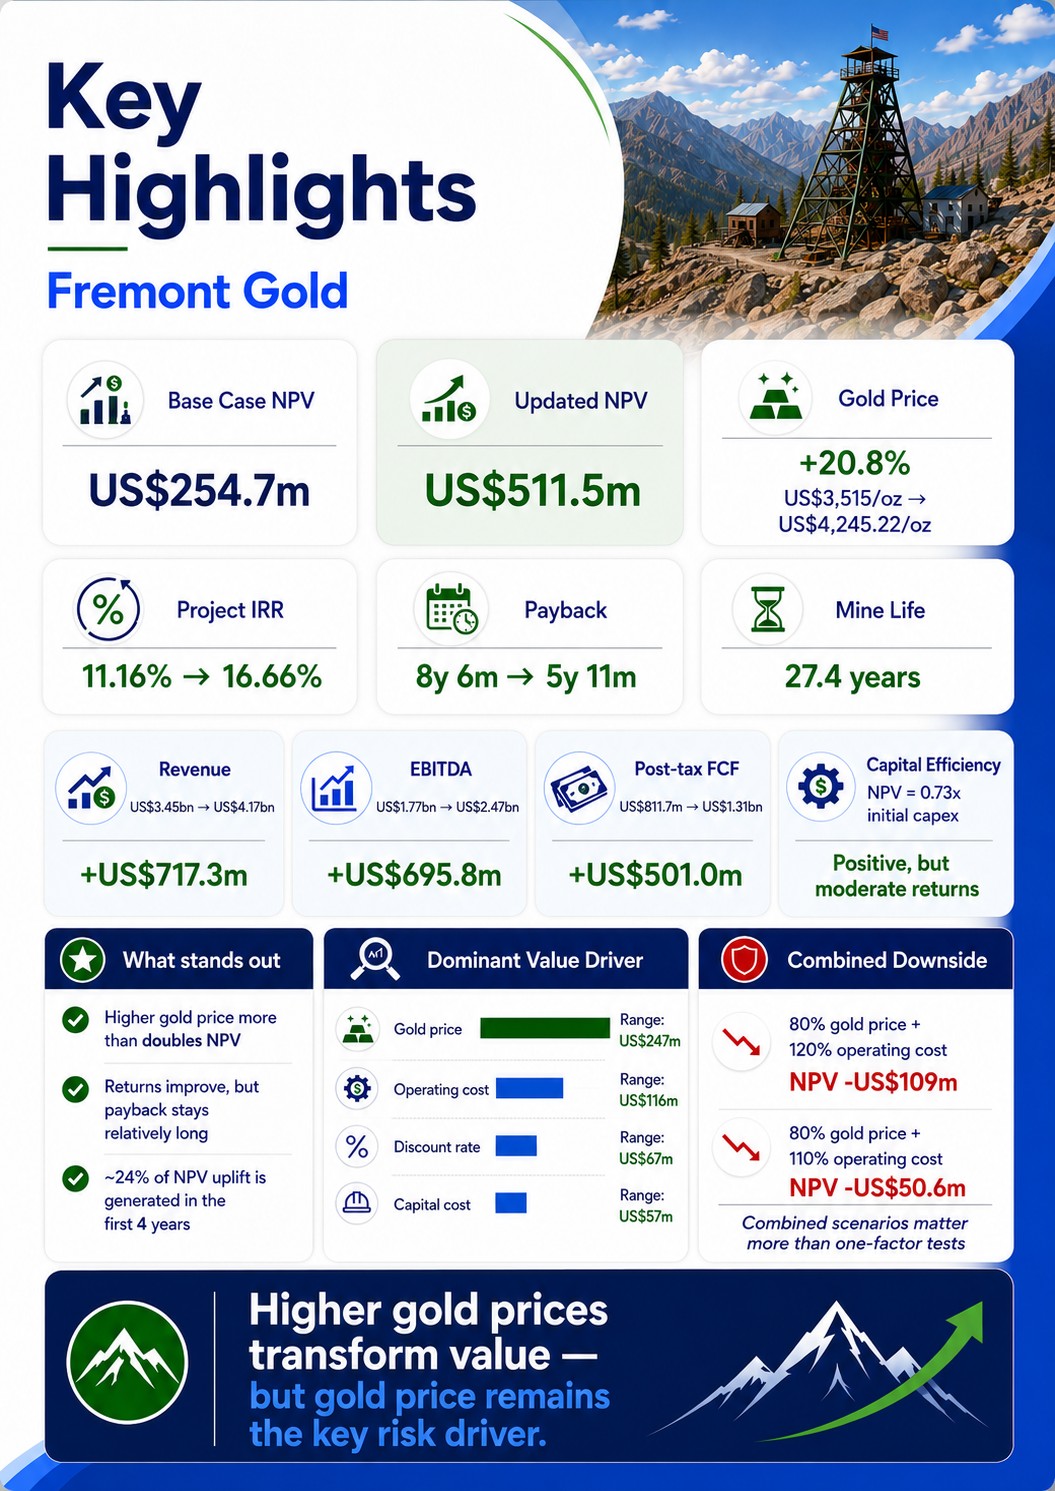
The report-based case produces positive, but moderate, modelled returns. Using the US$3,515/oz gold price applied in the technical report’s Mineral Resource assumptions, the Stormlands model produces a post-tax Project NPV of US$254.7 million, Project IRR of 11.16%, payback of eight years and six months, life-of-mine revenue of US$3.45 billion, life-of-mine EBITDA of US$1.77 billion and post-tax Project free cash flow of US$811.7 million. These results indicate a positive illustrative valuation, but the base case is not exceptionally capital-efficient. Project NPV is approximately 0.73 times the US$350 million initial capital assumption, and payback extends across almost one-third of the modelled mine life.
A 20.8% increase in gold price more than doubles Project NPV. Increasing the gold price from US$3,515/oz to US$4,245.22/oz raises post-tax Project NPV from approximately US$254.7 million to US$511.5 million. This is an increase of US$256.8 million, or 100.8%. The percentage increase in NPV is almost five times the percentage increase in gold price because most mining, processing and capital assumptions remain unchanged.
Project returns improve, but capital recovery remains relatively long. Project IRR increases from 11.16% to 16.66%. Undiscounted payback improves from eight years and six months to five years and eleven months, shortening by approximately two years and seven months. Discounted payback improves from approximately 11.3 operating years to approximately 7.2 operating years. The updated scenario reduces capital exposure, but the project still has a longer payback profile than a compact, high-grade development project.
Revenue and EBITDA show substantial leverage. Life-of-mine revenue increases from US$3.45 billion to US$4.17 billion, an increase of approximately US$717.3 million. Life-of-mine EBITDA increases from US$1.77 billion to US$2.47 billion, an increase of approximately US$695.8 million. The modelled EBITDA margin improves from approximately 51.4% to 59.2%.
Post-tax cash flow increases by approximately US$501 million. Cumulative post-tax Project free cash flow increases from approximately US$811.7 million to US$1.31 billion. During a normal full production year, post-tax Project free cash flow rises from approximately US$42.3 million to US$60.5 million. The first production year is lower because the model includes a US$9.5 million working-capital requirement, which is released during the final model year.
The value uplift is generated across a long mine life. Approximately US$61.8 million of the US$256.8 million NPV increase is generated during the first four operating years. Only about 24% of the NPV uplift is therefore produced during those first four years. The updated gold price improves cash flow from the start, but most of the increase is distributed across the remainder of the 27.4-year mine life.
Gold price is the dominant economic sensitivity. The one-factor sensitivity analysis moves Project NPV between approximately US$131 million and US$378 million across the tested gold-price range, a total valuation range of approximately US$247 million. Operating-cost sensitivity creates a range of approximately US$116 million, discount-rate sensitivity US$67 million and capital-cost sensitivity US$57 million.
Combined downside conditions can eliminate project value. At 80% of the base gold price and 120% of the base operating cost, the heatmap produces a Project NPV of approximately negative US$109 million. A 20% reduction in gold price combined with a 10% operating-cost increase also produces a negative NPV of approximately US$50.6 million. This shows why combined scenario analysis is more informative than testing each variable in isolation.
Project NPV and Returns
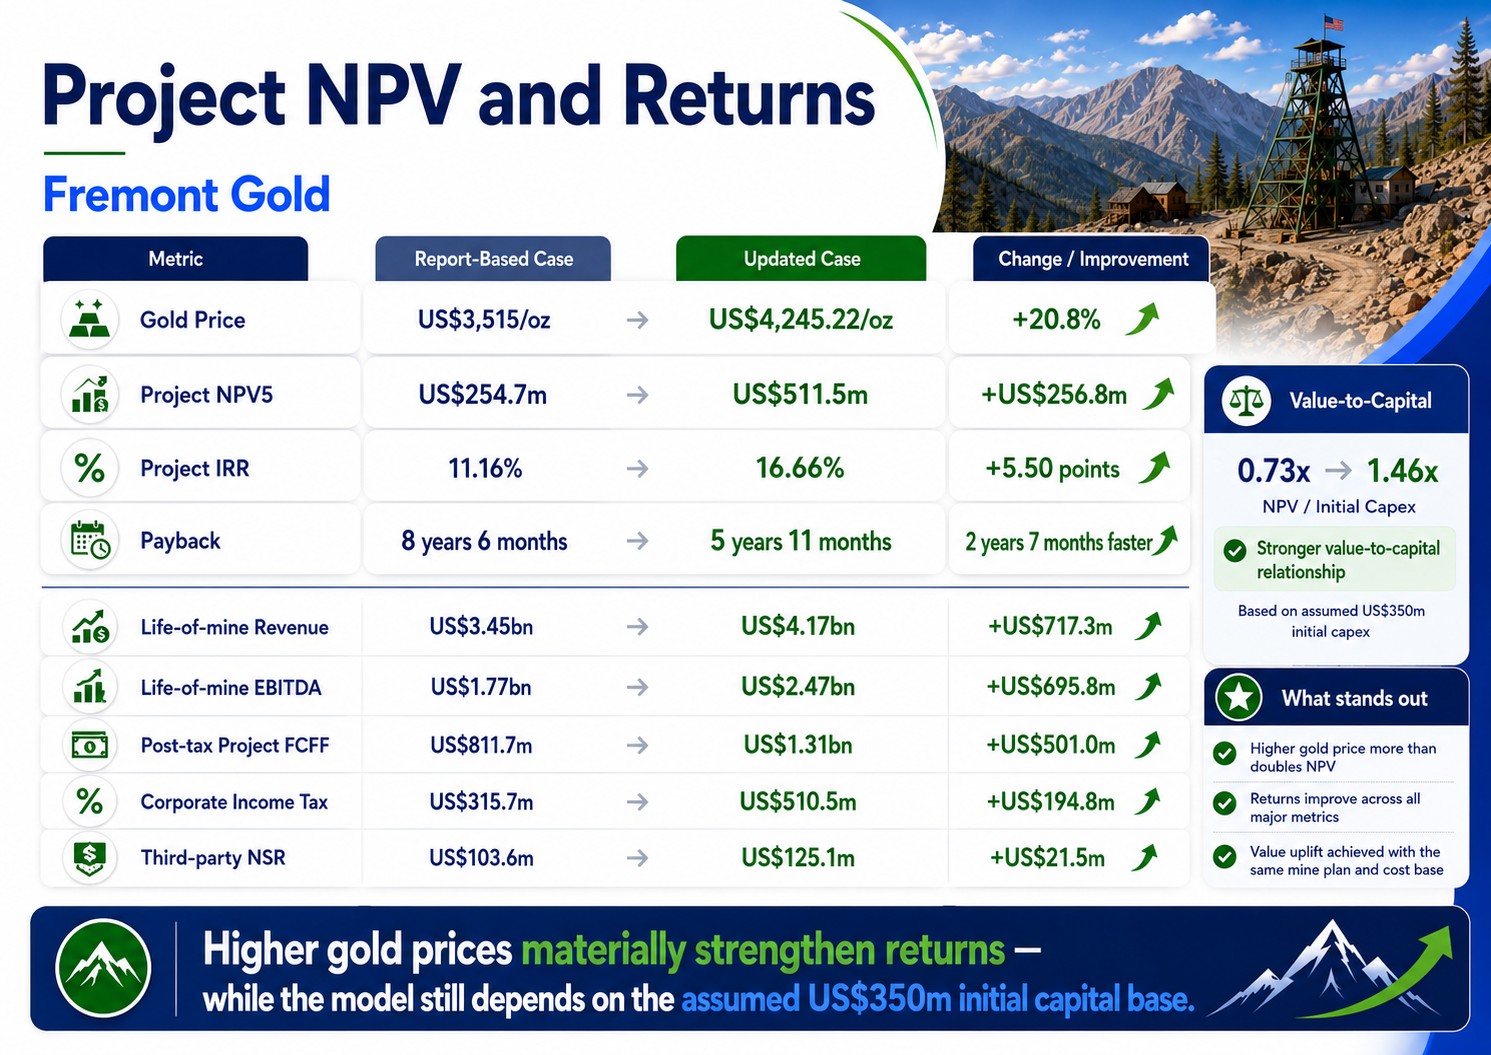
| Metric | Report-Based Case | Updated Case | Change |
| Gold price | US$3,515/oz | US$4,245.22/oz | +20.8% |
| Project NPV | US$254.7m | US$511.5m | +US$256.8m |
| Project IRR | 11.16% | 16.66% | +5.50 points |
| Payback | 8 years 6 months | 5 years 11 months | 2 years 7 months faster |
| Life-of-mine revenue | US$3.45bn | US$4.17bn | +US$717.3m |
| Life-of-mine EBITDA | US$1.77bn | US$2.47bn | +US$695.8m |
| Post-tax Project FCFF | US$811.7m | US$1.31bn | +US$501.0m |
| Corporate income tax | US$315.7m | US$510.5m | +US$194.8m |
| Third-party NSR | US$103.6m | US$125.1m | +US$21.5m |
NPV relative to initial capital increases from approximately 0.73 times initial capital in the report-based case to 1.46 times initial capital in the updated case. This materially strengthens the project’s modelled value-to-capital relationship. However, the relationship remains dependent on a US$350 million initial capital assumption that has not been established through detailed engineering in the current technical report.
Price Sensitivity and Unit Economics
Net Smelter Return and Operating Margin
| Unit Metric | Report-Based Case | Updated Case |
| Net smelter return | US$172.64/t | US$208.51/t |
| Operating cost | US$78.73/t | US$78.73/t |
| Cash operating margin | US$93.92/t | US$129.78/t |
| Operating margin | 54.4% | 62.24% |
| Modelled AISC | US$2,367.33/oz | US$2,389.23/oz |
The cash operating margin increases by approximately US$35.86/t, or 38.2%. The updated gold price therefore increases both the absolute margin per tonne and the percentage of revenue retained after operating costs.
Modelled AISC increases slightly in the updated scenario because the 3% NSR is linked to revenue. The implied margin between gold price and AISC increases from approximately US$1,148/oz to US$1,856/oz. The AISC calculation is a Stormlands model output and should not be described as an engineering estimate published in the NI 43-101.
Break-Even Gold Price and Cut-Off Grades
The modelled break-even gold price remains close to US$2,790/oz in both scenarios. The report-based gold price provides an illustrative margin of approximately US$726/oz above break-even, while the updated scenario increases that margin to approximately US$1,453/oz.
The modelled break-even cut-off grade falls from 0.76 g/t Au to 0.63 g/t Au. The mine-design cut-off grade falls from 1.07 g/t Au to 0.89 g/t Au. Both decline by approximately 17%.
This demonstrates how higher commodity prices can expand the theoretical economic envelope of the deposit. However, the current Stormlands model does not re-optimize the resource, stope shapes, mining inventory or production schedule. Tonnage, grade and mine life remain fixed. A formal study would need to determine whether lower cut-off grades could support additional mineable tonnes, different sequencing or a longer mine life.
DCF Model Insights
Annual Production and Revenue
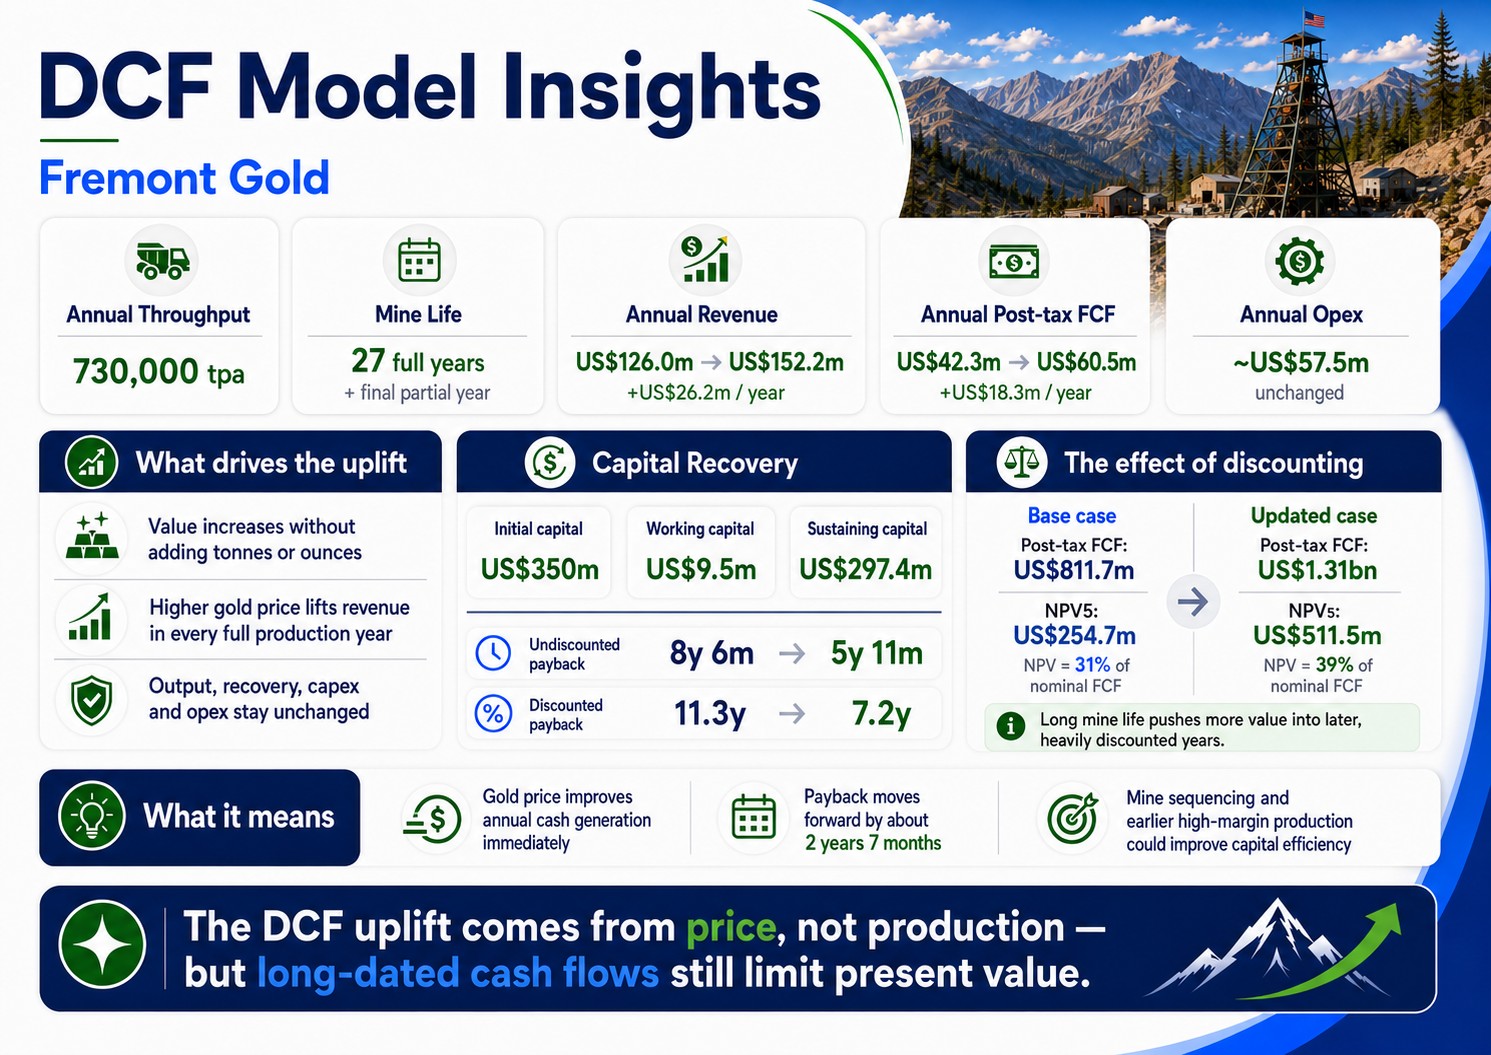
During each of the 27 full production years, the model processes approximately 730,000 tonnes. The final partial year processes approximately 290,000 tonnes. Annual gold production remains unchanged between the two scenarios. The increase in value is not generated by additional tonnes or ounces.
During each full operating year, revenue increases from approximately US$126.0 million at US$3,515/oz to approximately US$152.2 million at US$4,245.22/oz. The updated gold price adds approximately US$26.2 million of revenue per full operating year. Annual operating expenditure remains approximately US$57.5 million.
Annual Post-Tax Free Cash Flow
During a normal full production year, report-based post-tax Project free cash flow is approximately US$42.3 million. Updated post-tax Project free cash flow is approximately US$60.5 million. The annual increase is approximately US$18.3 million before discounting and is generated without changing output, recovery, capital expenditure or operating cost.
Capital Recovery
The model includes US$350 million of initial capital, US$9.5 million of working capital and approximately US$297.4 million of sustaining and replacement capital over the mine life.
In the report-based case, cumulative undiscounted Project cash flow becomes positive during the ninth operating year, producing payback of approximately eight years and six months. In the updated case, payback occurs during the sixth operating year, at approximately five years and eleven months. On a discounted basis, capital recovery improves from approximately 11.3 operating years to approximately 7.2 years.
The Effect of Discounting
The report-based case produces US$811.7 million of cumulative post-tax Project free cash flow, but a Project NPV of only US$254.7 million. NPV is therefore equivalent to approximately 31% of nominal cumulative post-tax cash flow. In the updated case, NPV is equivalent to approximately 39% of nominal post-tax cash flow.
This difference reflects the timing of cash generation. A large amount of Fremont’s value is generated many years after the initial investment and is therefore heavily discounted. Mine sequencing, production ramp-up and opportunities to bring higher-margin tonnes forward could have a significant effect on capital efficiency.
Stormlands Sensitivity Analysis
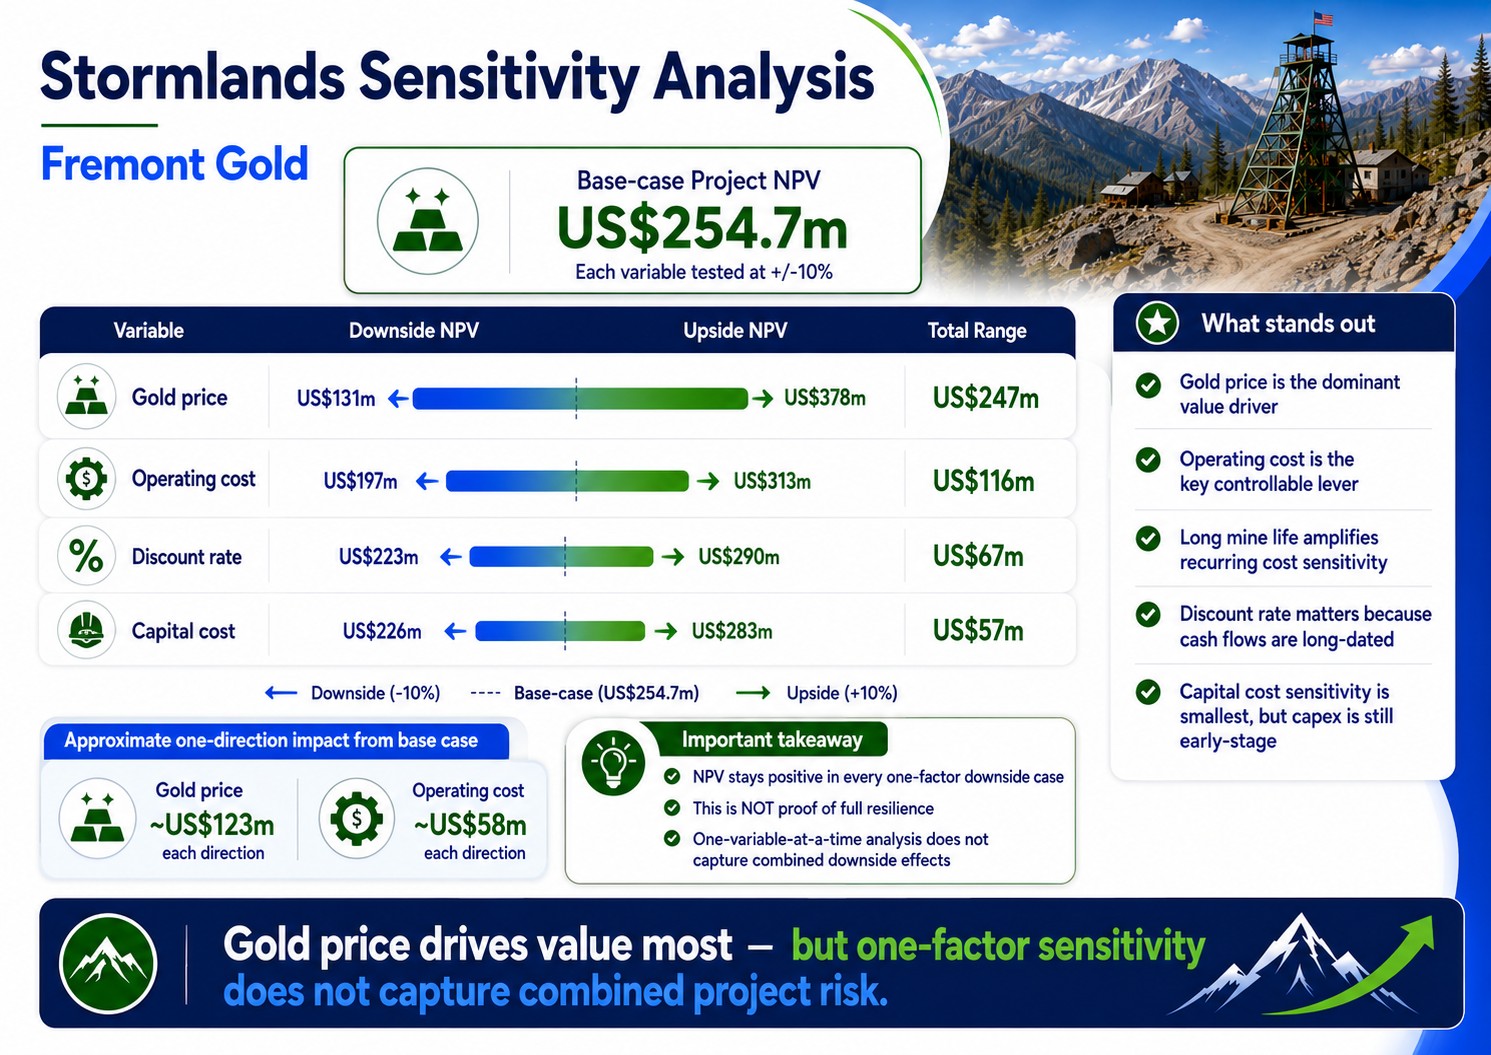
The sensitivity analysis begins with a base-case Project NPV of approximately US$254.7 million. It changes each variable independently, by increasing and decreasing each variable by 10%, while holding the remaining assumptions constant.
| Variable | Downside NPV | Upside NPV | Total Range |
| Gold price | US$131m | US$378m | US$247m |
| Operating cost | US$197m | US$313m | US$116m |
| Discount rate | US$223m | US$290m | US$67m |
| Capital cost | US$226m | US$283m | US$57m |
Gold price is the dominant value driver. An equivalent percentage movement in gold price changes NPV by approximately US$123 million in either direction. Operating cost is the second-largest sensitivity and the most important economic variable that management and project design can directly influence. Because the mine life is 27.4 years, relatively small recurring cost differences accumulate across a long operating period.
Discount-rate sensitivity is meaningful because of Fremont’s long cash-flow profile. Changes in perceived project risk, cost of capital or the rate applied to later cash flows have a material effect on present value.
Capital cost is the smallest of the four sensitivities tested. However, the capital assumptions are at an early level of definition. A wider escalation than the range shown could materially affect NPV, IRR, financing requirements and payback.
NPV remains positive in each individual downside case. This should not be interpreted as proof of economic resilience under all conditions because the analysis changes one variable at a time and does not capture interactions between lower prices, higher costs, delays or reduced recovery.
Heatmap Insights
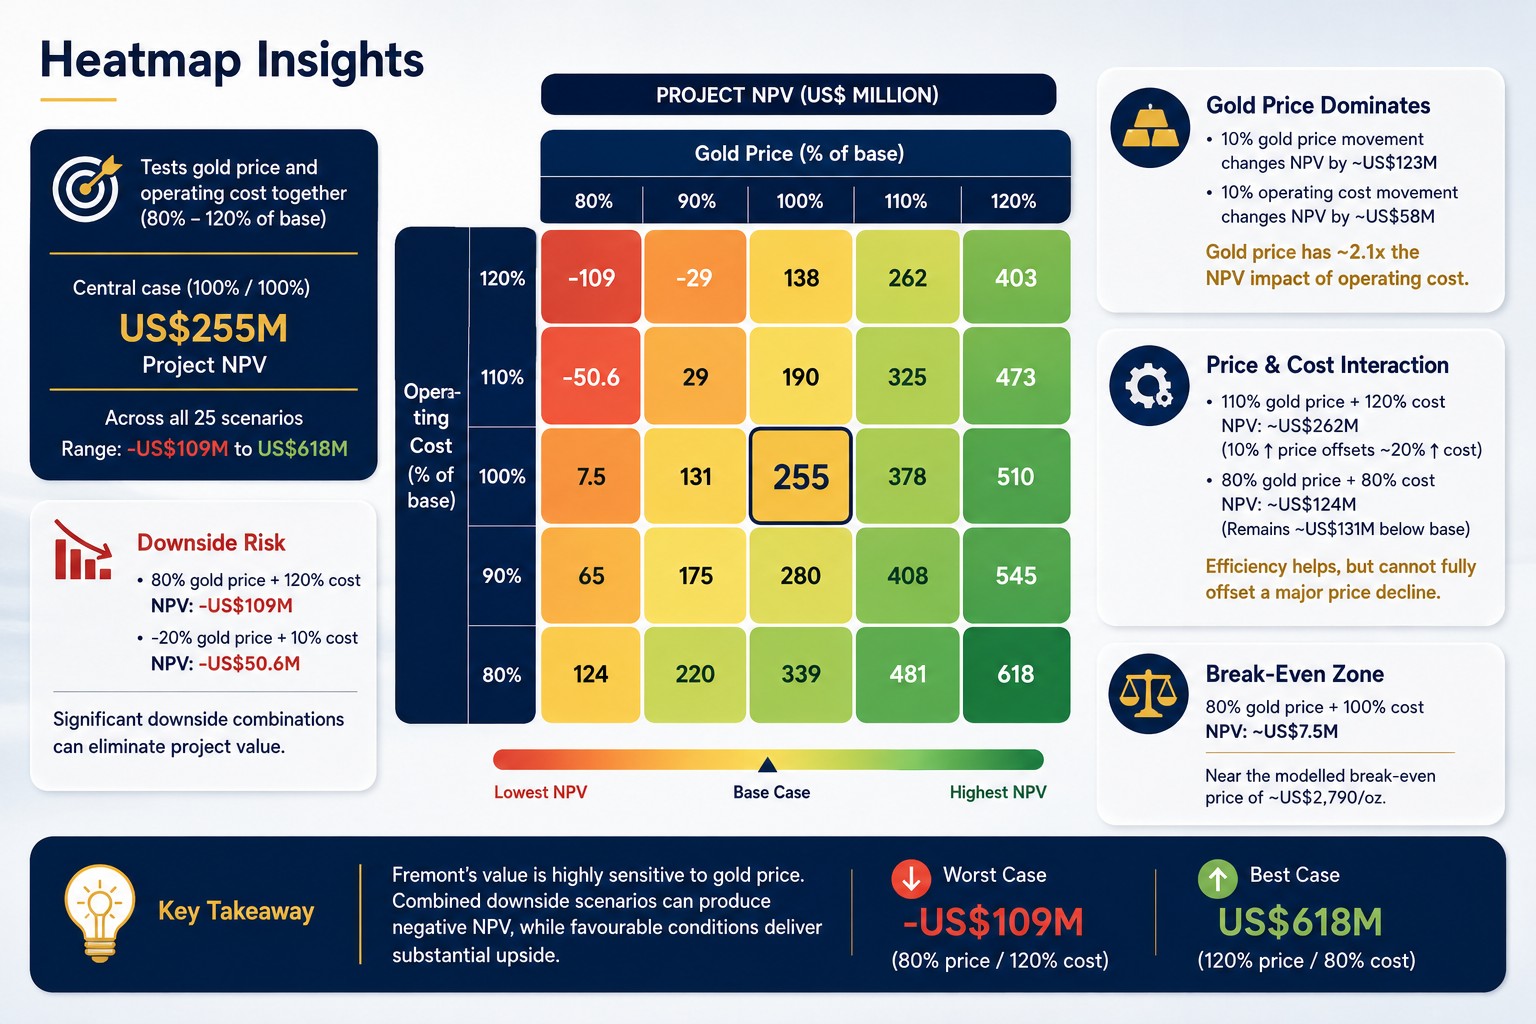
The heatmap tests gold price and operating cost simultaneously, varying both between 80% and 120% of their base assumptions. The central case is 100% gold price, 100% operating cost and a Project NPV of approximately US$255 million. Across all 25 scenarios, NPV ranges from negative US$109 million to positive US$618 million.
Downside and Upside Scenarios
At 80% of the base gold price and 120% of the base operating cost, Project NPV falls to approximately negative US$109 million. This is approximately US$364 million below the base case. A 20% reduction in price combined with only a 10% increase in operating cost also produces a negative NPV of approximately US$50.6 million.
At 120% of the base gold price and 80% of the base operating cost, Project NPV increases to approximately US$618 million. This is approximately US$363 million above the base case.
Gold Price Has Approximately Twice the Influence of Operating Cost
At the base operating cost, a 10% decrease in gold price reduces NPV to US$131 million and a 10% increase raises NPV to US$378 million. A 10% gold-price movement therefore changes NPV by approximately US$123 million.
At the base gold price, a 10% increase in operating cost reduces NPV to US$197 million and a 10% reduction increases NPV to US$313 million. A 10% operating-cost movement changes NPV by approximately US$58 million. On a percentage-for-percentage basis, gold price has approximately 2.1 times the NPV impact of operating cost.
Price and Cost Interaction
At 80% gold price and base operating cost, Project NPV is approximately US$7.5 million. This removes almost all the base-case value and aligns with the modelled break-even price of approximately US$2,790/oz.
At 110% gold price and 120% operating cost, Project NPV is approximately US$262 million, slightly higher than the base case despite a 20% operating-cost increase. Within this model, a 10% increase in gold price offsets approximately a 20% increase in operating cost.
At 80% gold price and 80% operating cost, Project NPV is approximately US$124 million. Even after a 20% operating-cost reduction, the project remains approximately US$131 million below the base NPV. Operating efficiency creates value, but it cannot fully compensate for a major decline in gold price.
Value Drivers
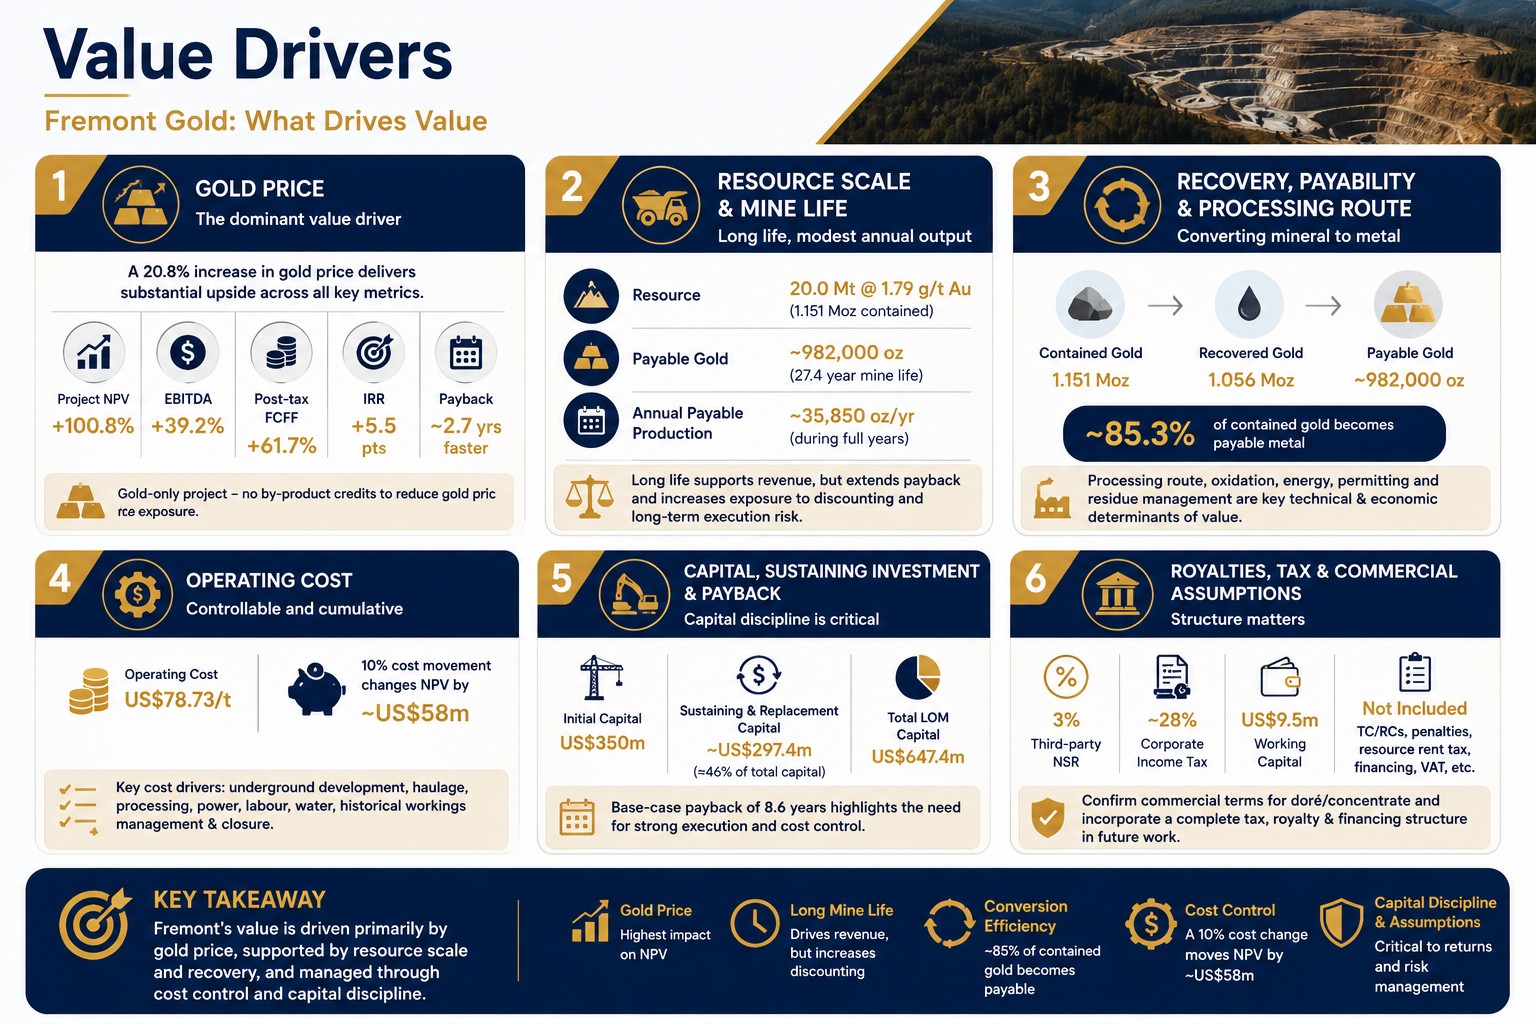
Gold price. Gold price is Fremont’s dominant economic value driver. A 20.8% increase in price produces a 100.8% increase in Project NPV, a 39.2% increase in EBITDA, a 61.7% increase in post-tax Project free cash flow, a 5.5 percentage-point improvement in IRR and a reduction of approximately two years and seven months in payback. Fremont is modelled as a gold-only project, so there are no meaningful by-product credits to reduce exposure to gold price.
Resource scale and mine life. The model is built around 20 Mt at 1.79 g/t Au and produces approximately 982,000 payable ounces over 27.4 years. The scale supports a long operating life, but annual production is relatively modest at approximately 35,850 payable ounces during each full year. The long life allows substantial cumulative revenue, but extends payback and exposes more value to discounting and long-term execution risk.
Recovery, payability and processing route. The model converts approximately 1.151 Moz of contained gold into 1.056 Moz of recovered gold and approximately 982,000 oz of payable gold. About 85.3% of contained gold becomes payable metal. Recovery varies by domain, and some sulphide material may require concentrate oxidation. Processing route, plant design, energy consumption, environmental permitting and residue management are therefore major technical and economic value drivers.
Operating cost. The model assumes operating costs of approximately US$78.73/t and life-of-mine operating expenditure of approximately US$1.57 billion. A 10% cost movement changes NPV by approximately US$58 million. Important cost drivers are likely to include underground development, haulage, ground support, ventilation, processing, oxidation, labour, power, water treatment, management of historical workings and closure.
Capital, sustaining investment and payback. The model assumes initial capital of US$350 million, sustaining and replacement capital of approximately US$297.4 million and total life-of-mine capital of US$647.4 million. Sustaining capital represents approximately 46% of total life-of-mine capital. The base-case IRR and payback indicate that capital discipline would be critical.
Royalties, tax and commercial assumptions. The model includes a 3% revenue-based third-party NSR, approximately 28% corporate income tax and US$9.5 million of working capital. It does not include treatment charges, refining charges, penalties, financing expenses, resource rent tax, state participation or VAT recovery. Future work should confirm the commercial terms associated with any doré, concentrate or intermediate product and incorporate a complete tax, royalty and financing structure.
Conclusion
Stormlands’ illustrative model of the Fremont Gold Property shows a large, long-life underground gold project with positive modelled economics and substantial leverage to gold price.
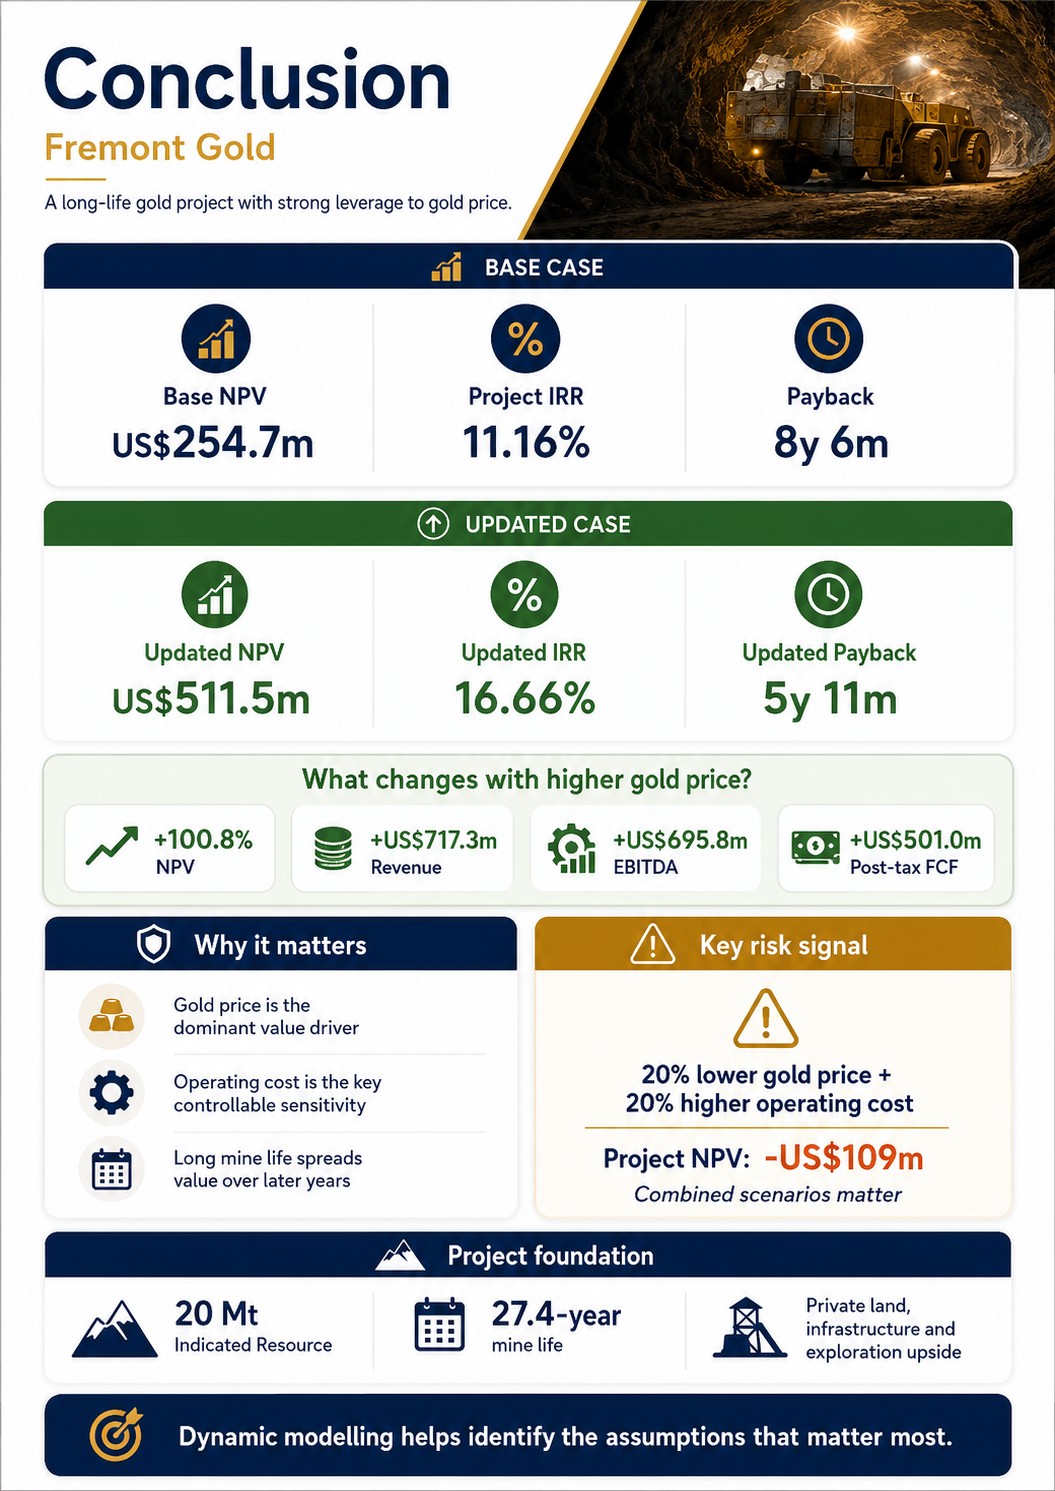
Using the 20 Mt Indicated Mineral Resource and the US$3,515/oz gold price applied in the technical report’s resource assumptions, the model produces a post-tax Project NPV of approximately US$254.7 million, Project IRR of 11.16%, payback of eight years and six months, life-of-mine revenue of approximately US$3.45 billion, life-of-mine EBITDA of approximately US$1.77 billion and post-tax Project free cash flow of approximately US$811.7 million.
Under the updated US$4,245.22/oz gold-price scenario, Project NPV increases to approximately US$511.5 million, Project IRR increases to 16.66%, payback shortens to five years and eleven months, life-of-mine revenue increases by approximately US$717.3 million, EBITDA increases by approximately US$695.8 million and post-tax Project free cash flow increases by approximately US$501.0 million.
The DCF model shows that higher gold prices improve cash generation from the beginning of production. However, Fremont’s long mine life means that most of the NPV uplift is distributed across later years. Capital recovery remains an important consideration even under the updated scenario.
The sensitivity analysis and heatmap identify gold price as the dominant value driver. Operating cost is the principal controllable economic sensitivity, but cost reductions cannot fully offset a material decline in gold price. The heatmap also demonstrates why combined scenario analysis is important: while NPV remains positive in every individual one-factor downside case, a 20% fall in gold price combined with a 20% increase in operating cost produces a negative NPV of approximately US$109 million.
Fremont’s infrastructure, private-land position, historic production and large reported resource base provide a potentially valuable development foundation. The project also has substantial Inferred Resources and additional exploration potential that are not reflected in the current model.
The broader insight is more important than any individual model output. Fremont demonstrates how Stormlands can transform the technical assumptions supporting a Mineral Resource Estimate into a dynamic valuation framework before a current formal economic study has established project economics.
This allows investors, analysts and project teams to understand which assumptions create value, when value is generated, how commodity prices affect capital recovery, which downside combinations threaten economic viability and which technical questions should be addressed in the next stage of study.
Dynamic modelling does not replace a PEA, prefeasibility study or feasibility study. It provides a structured method for understanding the economic implications of technical disclosure and directing future work towards the assumptions that matter most.
About Stormlands
Stormlands Mining is an AI-first valuation and analytics platform for mining assets and critical minerals. The platform helps users turn technical disclosures into interactive valuation models in minutes, rather than days or weeks. The valuation models are accessible over multiple platforms to all users, enabling the user to interact directly with the data to facilitate scenario-planning.
The platform enables users to build discounted cash flow models at scale, test commodity price, capex, opex, tax, royalty rates, discount-rates and production scenarios, and compare opportunities and scenarios.
Stormlands is using this technology to build the Stormlands Library: a global repository of mining asset valuation models. It has moved beyond a tool for analysts building individual models and is developing a data layer for the mining industry: a structured source of valuation models and illustrative scenarios. This creates a new way for investors, corporates, professional advisers, financial-market users and public-policy stakeholders to screen assets, benchmark projects and understand the key drivers of mining asset economics.
If you are interested in accessing the models in the library, email ceo@stormlandsmining.com
Important Notice
This analysis has been prepared by Stormlands Mining using publicly available information from the NI 43-101 Technical Report together with Stormlands’ own independent modelling assumptions.
The analysis is illustrative only. It is not a Preliminary Economic Assessment, Pre-Feasibility Study, Feasibility Study, Mineral Reserve estimate or independent technical report. It has not been prepared on behalf of the project owner and has not been reviewed or approved by the project owner.
The model outputs are Stormlands-generated illustrative estimates only. They should not be interpreted as demonstrated economic viability. Future technical work, including mine planning, metallurgical testing, engineering, environmental studies, permitting, capital-cost estimation and operating-cost estimation, would be required before any formal economic conclusions could be drawn.