
Frotet Gold Project
The analysis is based on Stormlands Mining’s independent modelling using publicly available technical information, including the NI 43-101 Technical Report November 2025.
Stormlands Mining illustrative economic analysis based on NI 43-101 MRE
Introduction
The Frotet Project’s Regnault Deposit is one of the most significant recent high-grade gold discoveries in Canada. Located 120 km north of Chibougamau, Québec, the deposit contains an Inferred Mineral Resource of 14.5 million tonnes grading 5.47 g/t gold and 5.18 g/t silver, containing 2.55 million ounces of gold and 2.41 million ounces of silver.
Unlike many advanced-stage development projects, the NI 43-101 technical report for Regnault does not contain a Preliminary Economic Assessment (PEA), Pre-Feasibility Study (PFS) or Feasibility Study (FS). The report focuses on establishing the Mineral Resource Estimate and documenting the geological, metallurgical and technical characteristics of the discovery.
Stormlands Mining has used the NI 43-101 MRE as the foundation for an illustrative economic valuation model. The objective is not to replace a formal economic study, but to demonstrate how technical disclosure can be transformed into a dynamic valuation framework that allows investors, analysts and project teams to understand value drivers, test assumptions and evaluate economic potential.
This case study demonstrates how a mineral resource estimate can be converted into a dynamic valuation model before a formal economic study exists.
Project Economics
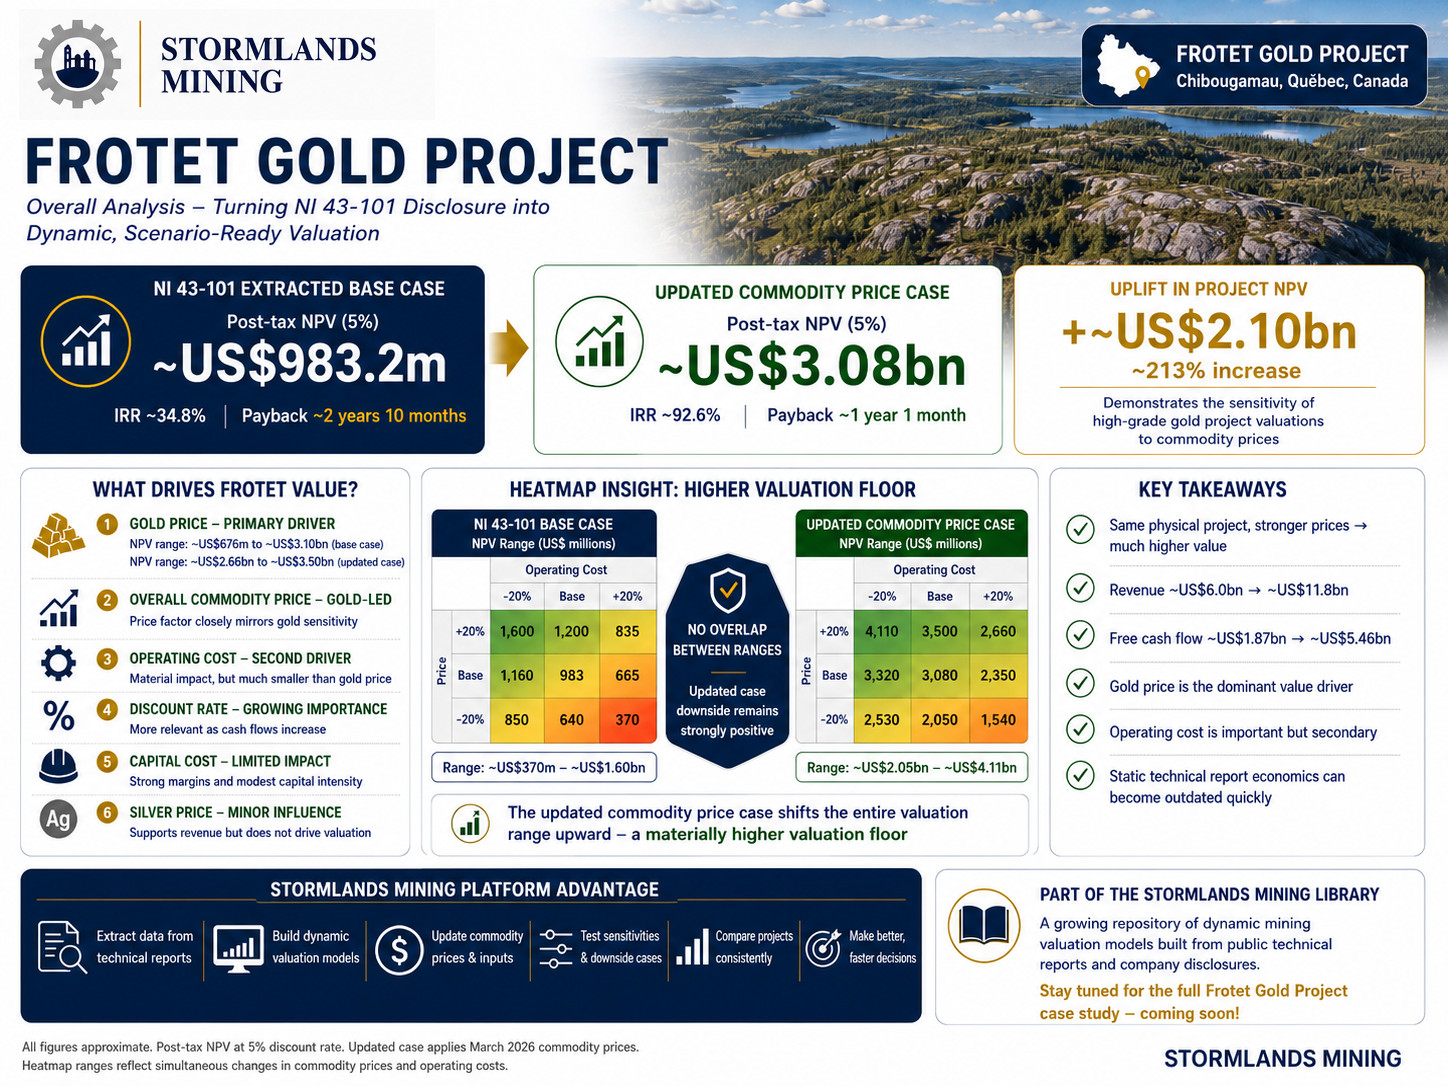
Using data extracted from the NI 43-101 technical report, the Stormlands base case model generates:
NI 43-101 Base Case
- Post-tax NPV5%: US$983.2 million
- Post-tax IRR: 34.8%
- Payback Period: 2 years 10 months
- Life-of-Mine Revenue: US$6.0 billion
- Life-of-Mine EBITDA: US$3.47 billion
- Life-of-Mine Free Cash Flow: US$1.87 billion
- Initial Capital: US$300 million
Updated Commodity Price Scenario
Applying March 2026 commodity prices while keeping the mine plan, production schedule, recoveries, operating costs and capital costs unchanged produces:
- Post-tax NPV5%: US$3.08 billion
- Post-tax IRR: 92.6%
- Payback Period: 1 year 1 month
- Life-of-Mine Revenue: US$11.8 billion
- Life-of-Mine EBITDA: US$8.99 billion
- Life-of-Mine Free Cash Flow: US$5.46 billion
These figures are Stormlands model outputs and are not published economic results from the NI 43-101 technical report.
Key Highlights
Base Case Economics Are Already Robust
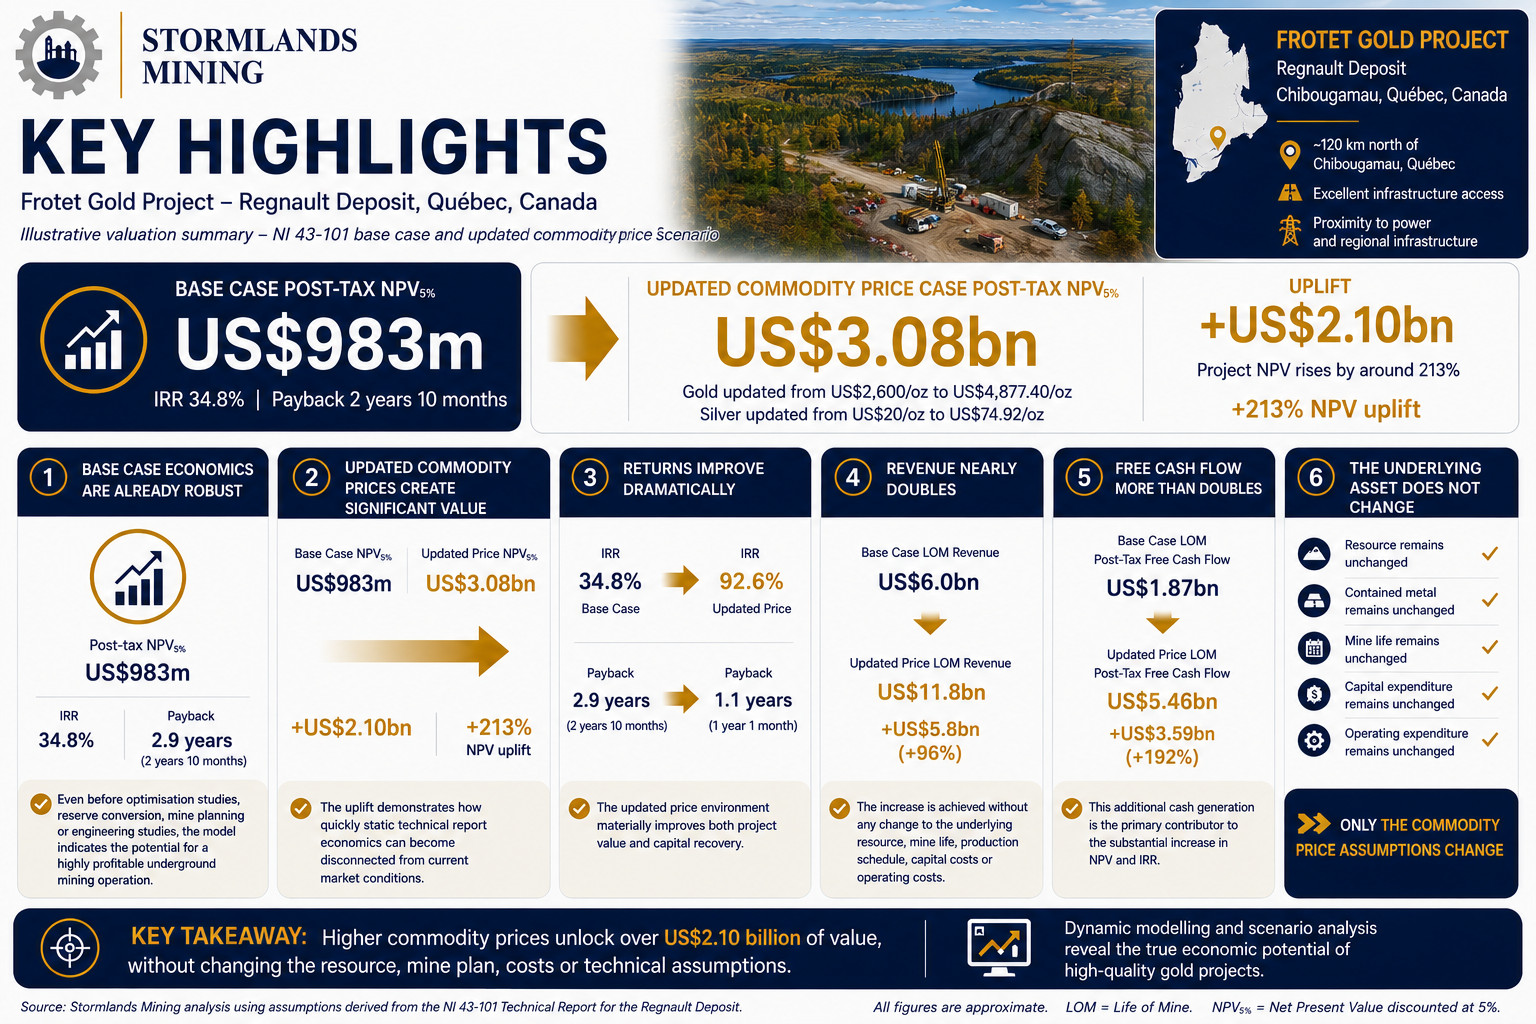
Using data extracted from the NI 43-101 resource estimate, the Stormlands model generates a post-tax NPV5% of US$983 million and an IRR of 34.8%.
Even before optimisation studies, reserve conversion, mine planning or engineering studies, the model indicates the potential for a highly profitable underground mining operation.
Updated Commodity Prices Create Significant Value
Updating commodity prices while keeping all technical assumptions unchanged increases project NPV from US$983 million to US$3.08 billion.
This represents an increase of US$2.10 billion or 213%.
The uplift demonstrates how quickly static technical report economics can become disconnected from current market conditions.
Returns Improve Dramatically
Project IRR increases from 34.8% to 92.6%.
Payback improves from 2 years and 10 months to 1 year and 1 month.
The updated price environment materially improves both project value and capital recovery.
Revenue Nearly Doubles
Life-of-mine revenue increases from US$6.0 billion to US$11.8 billion.
The increase is achieved without any change to the underlying resource, mine life, production schedule, capital costs or operating costs.
Free Cash Flow More Than Doubles
Life-of-mine post-tax free cash flow increases from US$1.87 billion to US$5.46 billion.
This additional cash generation is the primary contributor to the substantial increase in NPV and IRR.
The Underlying Asset Does Not Change
The resource remains unchanged.
Contained metal remains unchanged.
Mine life remains unchanged.
Capital expenditure remains unchanged.
Operating expenditure remains unchanged.
Only the commodity price assumptions change.
This demonstrates the value of dynamic modelling and scenario analysis when evaluating mining projects.
DCF model insights
Value Creation Comes From Margin Expansion
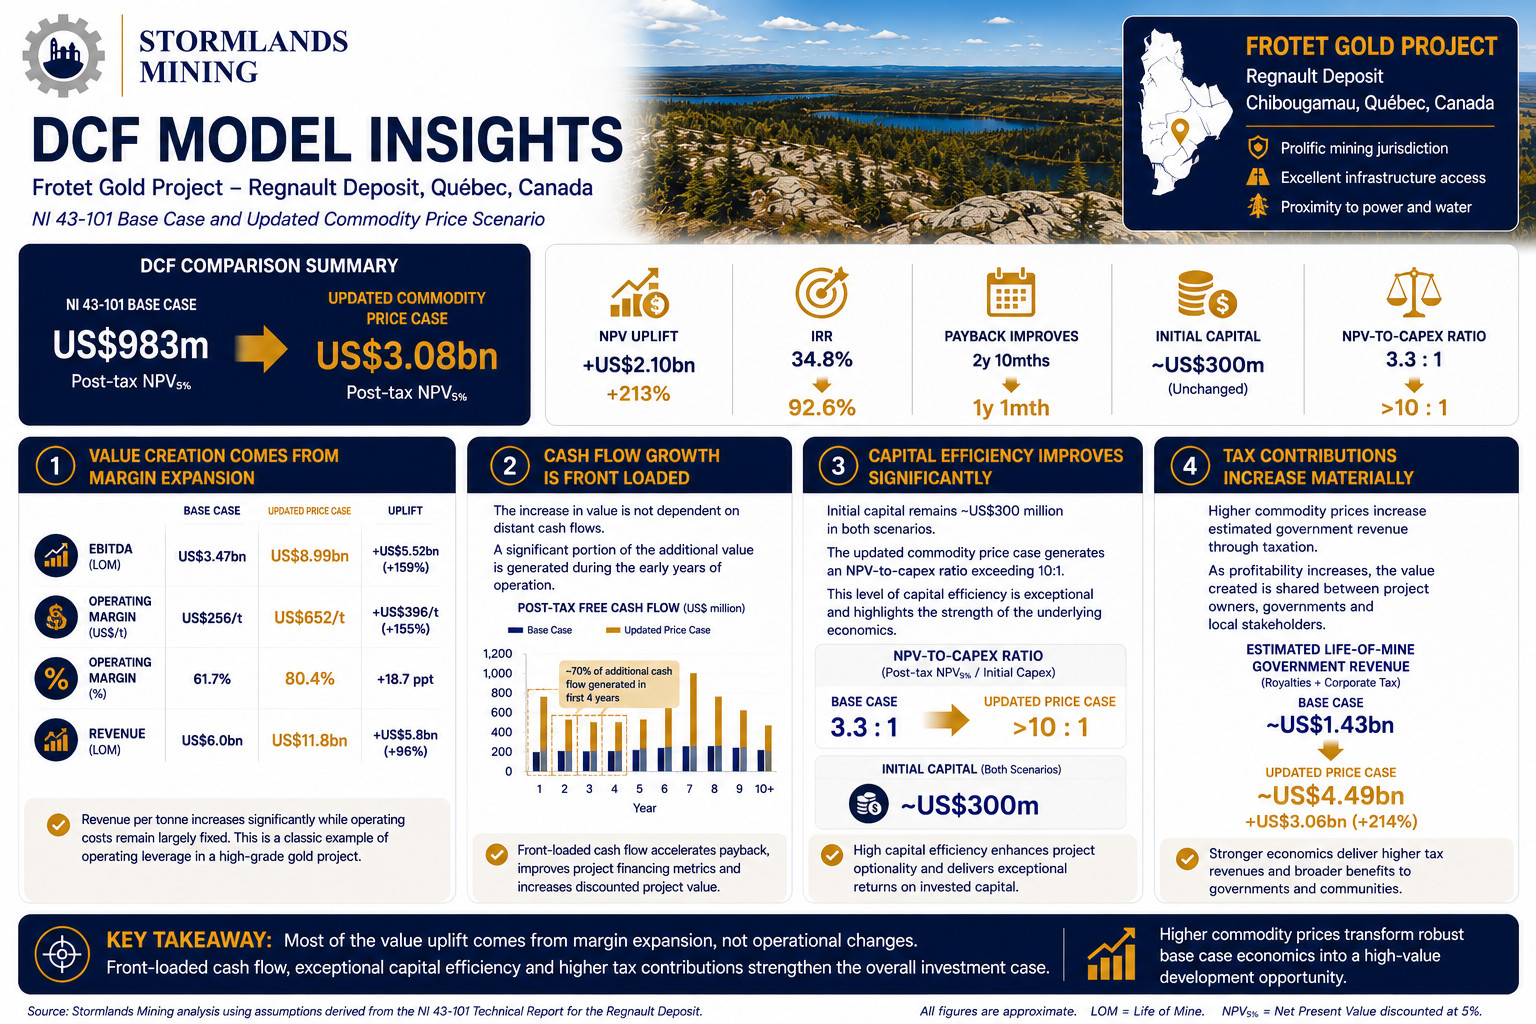
The discounted cash flow comparison demonstrates that most of the value uplift comes from margin expansion rather than operational changes.
Revenue per tonne increases significantly while operating costs remain largely fixed.
As a result:
- EBITDA increases from US$3.47 billion to US$8.99 billion.
- Operating margin increases from US$256/t to US$652/t.
- Operating margin increases from 7% to 80.4%.
This is a classic example of operating leverage in a high-grade gold project.
Cash Flow Growth Is Front Loaded
The increase in value is not dependent on distant cash flows.
A significant portion of the additional value is generated during the early years of operation.
This accelerates payback, improves project financing metrics and increases discounted project value.
Capital Efficiency Improves Significantly
Initial capital remains US$300 million in both scenarios.
The updated commodity price case generates an NPV-to-capex ratio exceeding 10:1.
This level of capital efficiency is exceptional and highlights the strength of the underlying economics.
Tax Contributions Increase Materially
Higher commodity prices increase estimated government revenue through taxation.
As profitability increases, the value created is shared between project owners, governments and local stakeholders.
Value Drivers
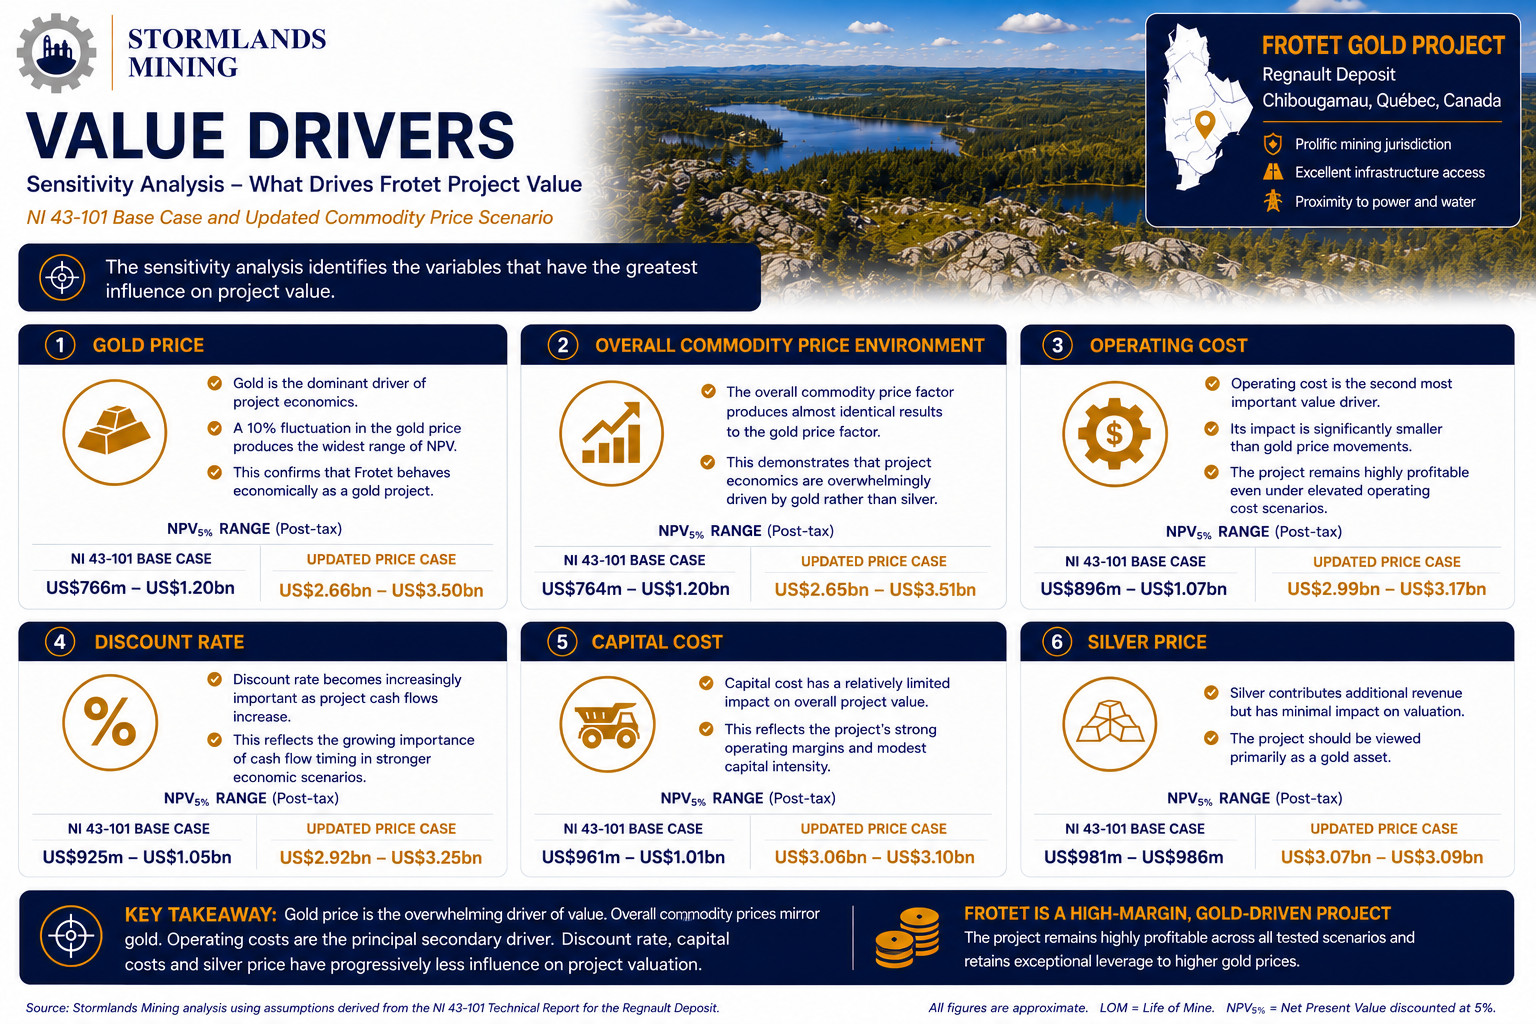
The sensitivity analysis identifies the variables that have the greatest influence on project value.
- Gold Price
Gold is the dominant driver of project economics.
Under the NI 43-101 base case, a 10% fluctuation in the gold price produces NPV ranges from US$766 million to US$1.20 billion.
This confirms that Frotet behaves economically as a gold project.
- Overall Commodity Price Environment
The overall commodity price factor produces almost identical results to the gold price factor.
This demonstrates that project economics are overwhelmingly driven by gold rather than silver.
- Operating Cost
Operating cost is the second most important value driver.
However, its impact is significantly smaller than gold price movements.
The project remains highly profitable even under elevated operating cost scenarios.
- Discount Rate
Discount rate becomes increasingly important as project cash flows increase.
This reflects the growing importance of cash flow timing in stronger economic scenarios.
- Capital Cost
Capital cost has a relatively limited impact on overall project value.
This reflects the project’s strong operating margins and modest capital intensity.
- Silver Price
Silver contributes additional revenue but has minimal impact on valuation.
The project should be viewed primarily as a gold asset.
Sensitivity Analysis
The sensitivity analysis provides one of the clearest views of what drives value at Frotet.
NI 43-101 Base Case Sensitivity
Base case NPV: US$983 million
Gold price from NI 43-101: US$2,500 per TOz
Silver price from NI 43-101: US$30 per TOz
Gold Price
Downside Case (-10%): US$766 million
Upside Case (+10%): US$1.20 billion
Gold creates US$434 million of valuation movement around the base case.
Commodity Price Factor
Downside Case (-10%): US$764 million
Upside Case (+10%): US$1.20 billion
This mirrors the gold price sensitivity and confirms gold dominates project value.
Operating Cost
Downside Case (+10%): US$896 million
Upside Case (-10%): US$1.07 billion
Operating costs matter, but far less than gold prices.
Discount Rate
Downside Case (-10%): US$925 million
Upside Case (+10%): US$1.05 billion
Discount rate has a visible but secondary impact.
Capital Cost
Downside Case: US$961 million
Upside Case: US$1.01 billion
Capital cost changes have relatively limited influence.
Silver Price
Downside Case (-10%): US$981 million
Upside Case (+10%): US$986 million
Silver contributes very little to valuation.
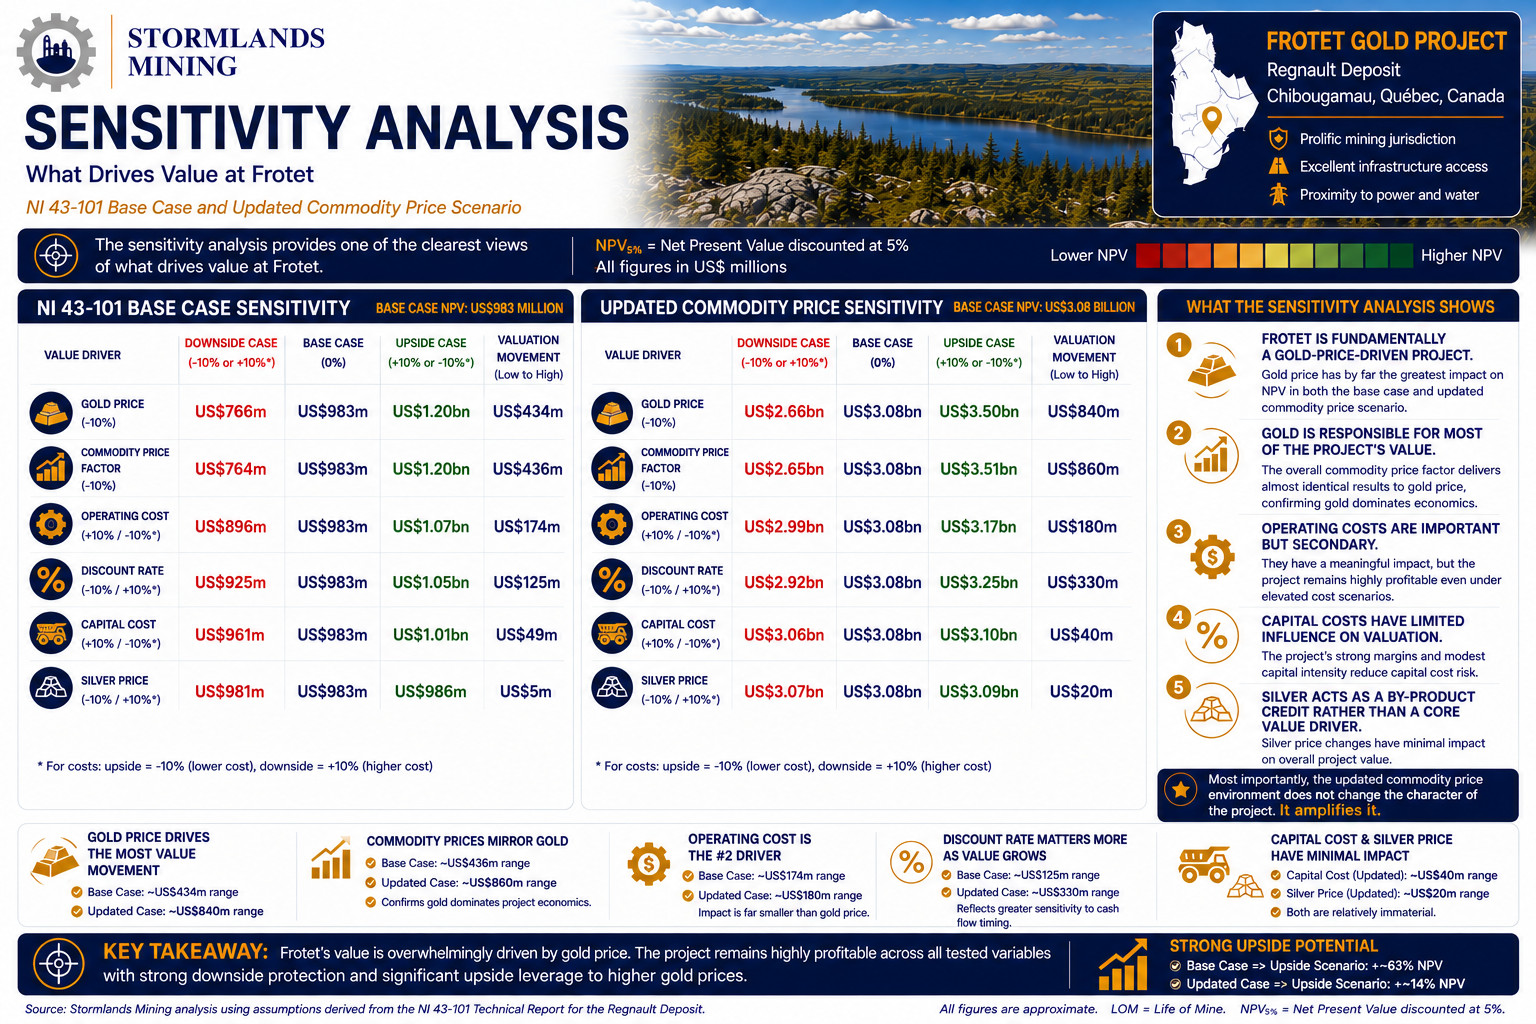
Updated commodity price sensitivity
NPV: rises from US$983 million to US$3.08 billion
Updated gold price: US$4877 per TOz
Updated silver price: US$75 per TOz
Gold Price
Downside Case (-10%): US$2.66 billion
Upside Case (+10%): US$3.50 billion
Gold price drives US$840 million of value movement.
Commodity Price Factor
Downside Case (-10%): US$2.65 billion
Upside Case (+10%): US$3.51 billion
Again, gold dominates the economics.
Discount Rate
Downside Case (-10%): US$2.92 billion
Upside Case (+10%): US$3.25 billion
Discount rate becomes more important as cash flows grow.
Operating Cost
Downside Case (+10%): US$2.99 billion
Upside Case (-10%): US$3.17 billion
Operating costs remain secondary to gold price.
Capital Cost
Downside Case (+10%): US$3.06 billion
Upside Case (-10%): US$3.10 billion
Capital cost remains a minor value driver.
Silver Price
Downside Case (-10%): US$3.07 billion
Upside Case (+10%): US$3.09 billion
Silver remains largely immaterial to project valuation.
What the Sensitivity Analysis Shows
- The sensitivity analysis demonstrates five key conclusions:
- Frotet is fundamentally a gold-price-driven project.
- Gold is responsible for most of the project’s economic value.
- Operating costs are important but secondary.
- Capital costs have limited influence on valuation.
- Silver acts as a by-product credit rather than a core value driver.
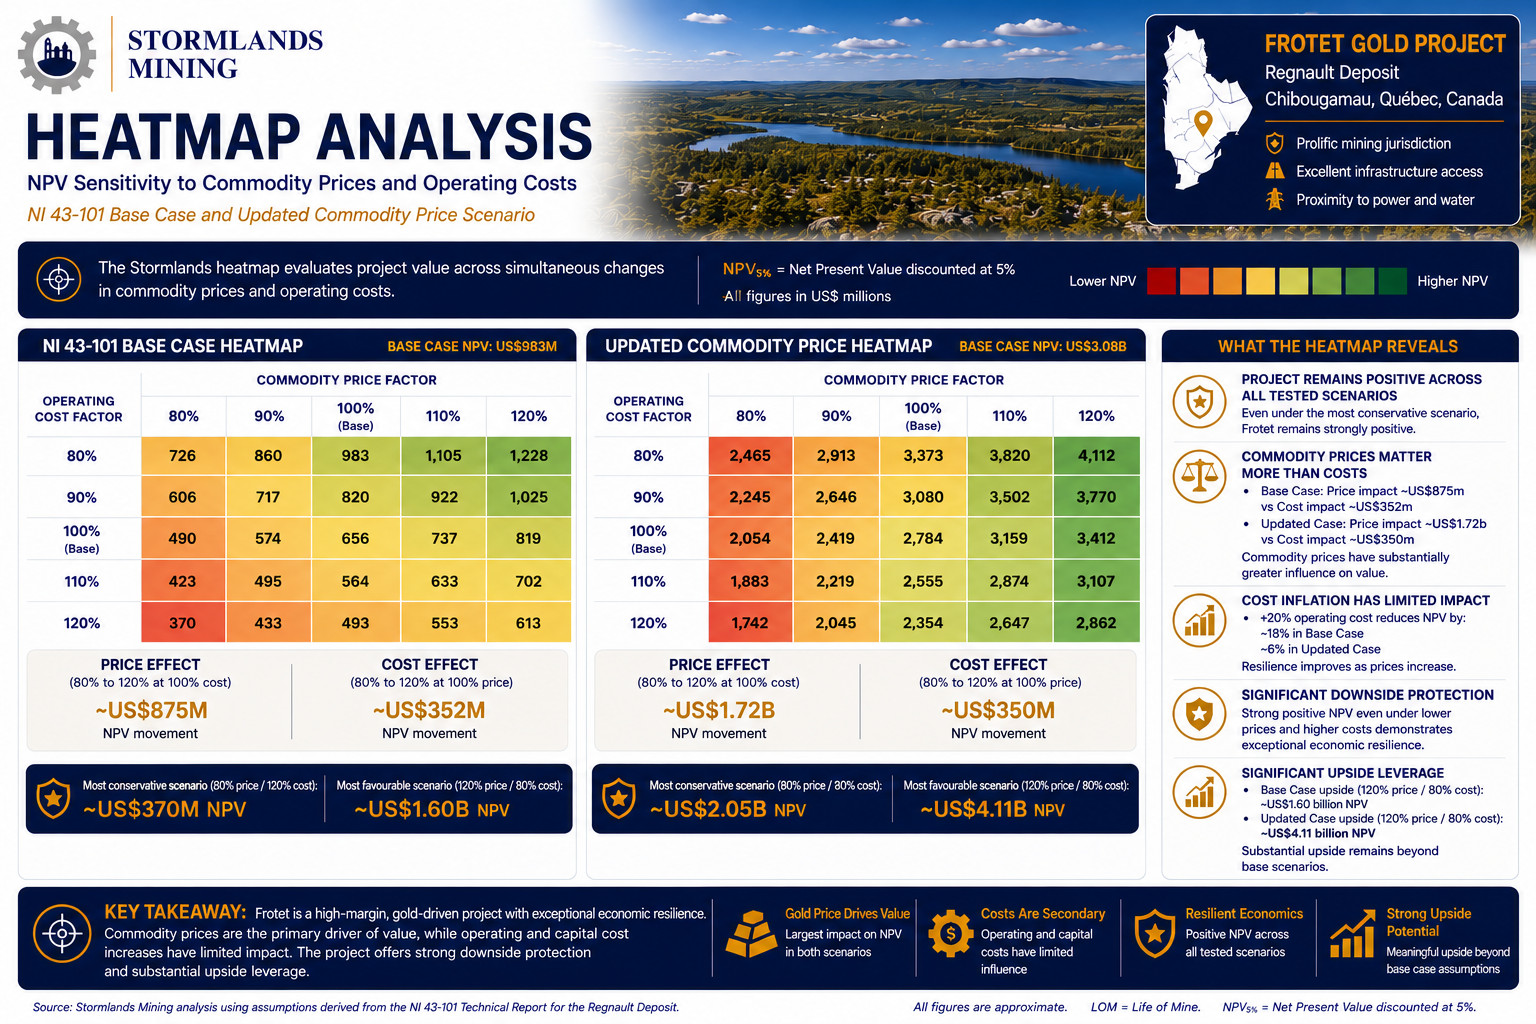
Heatmap
The Stormlands heatmap evaluates project value across simultaneous changes in commodity prices and operating costs.
The Project Remains Positive Across All Tested Scenarios
Under the NI 43-101 case, the most conservative scenario still generates US$370 million of NPV.
Under updated commodity prices, the equivalent downside scenario still generates US$2.05 billion of NPV.
This demonstrates exceptional economic resilience.
Commodity Prices Matter More Than Costs
Under the NI 43-101 case:
Price changes create US$875 million of NPV movement.
Cost changes create US$352 million of NPV movement.
Under updated commodity prices:
– Price changes create US$1.72 billion of NPV movement.
– Cost changes create US$350 million of NPV movement.
Commodity prices therefore have substantially greater influence on value than operating costs.
Cost Inflation Has Limited Impact
A 20% increase in operating costs:
– Reduces NPV by 18% in the NI 43-101 case.
– Reduces NPV by 6% in the updated commodity price case.
This demonstrates increasing resilience as commodity prices rise.
Significant Downside Protection
Even under lower commodity prices and higher operating costs, the project remains strongly positive.
This is a powerful indicator of economic robustness.
Significant Upside Leverage
Under stronger commodity prices and lower operating costs:
– NI 43-101 NPV increases to US$1.60 billion.
– Updated commodity price NPV increases to US$4.11 billion.
The project therefore retains substantial upside beyond the base scenarios.
Commodity Price Leverage
Frotet exhibits exceptional leverage to gold prices.
Under the updated commodity price scenario:
- NPV increases to US$3.08 billion.
- IRR increases to 6%.
- Payback falls to 13 months.
- Operating margin exceeds 80%.
The underlying geology remains unchanged.
The improvement comes entirely from the market environment.
This is one of the clearest examples within the Stormlands Library of how commodity prices can materially alter project economics without any change to technical disclosure.
Conclusion
The Frotet Project case study demonstrates the value of transforming technical disclosure into a dynamic economic model.
Using assumptions derived from the NI 43-101 technical report, Stormlands generated a base case post-tax NPV of US$983 million, an IRR of 34.8% and payback of 2 years and 10 months.
Applying March 2026 commodity prices increased project NPV to US$3.08 billion, IRR to 92.6% and reduced payback to 13 months.
The sensitivity analysis confirms that Frotet is fundamentally a gold-price-driven project, with operating cost acting as the principal secondary value driver. The heatmap analysis demonstrates that the project remains positive across all tested scenarios and becomes increasingly resilient as commodity prices strengthen.
Most importantly, the case study highlights how static technical reports can rapidly become disconnected from current market conditions. The underlying resource remains unchanged, but the economic interpretation changes dramatically.
That ability to move from technical disclosure to dynamic valuation is the core purpose of the Stormlands platform.
About Stormlands
Stormlands Mining is an AI-first valuation and analytics platform for mining assets and critical minerals. The platform helps users turn technical disclosures into interactive valuation models in minutes, rather than days or weeks. The valuation models are accessible over multiple platforms to all users, enabling the user to interact directly with the data to facilitate scenario-planning.
The platform enables users to build discounted cash flow models at scale, test commodity price, capex, opex, tax, royalty rates, discount-rates and production scenarios, and compare opportunities and scenarios.
Stormlands is using this technology to build the Stormlands Library: a global repository of mining asset valuation models. It has moved beyond a tool for analysts building individual models and is developing a data layer for the mining industry: a structured source of valuation models and illustrative scenarios. This creates a new way for investors, corporates, professional advisers, financial-market users and public-policy stakeholders to screen assets, benchmark projects and understand the key drivers of mining asset economics.
If you are interested in accessing the models in the library, email ceo@stormlandsmining.com
Important Notice
This analysis has been prepared by Stormlands Mining using publicly available information from the NI 43-101 Technical Report together with Stormlands’ own independent modelling assumptions.
The analysis is illustrative only. It is not a Preliminary Economic Assessment, Pre-Feasibility Study, Feasibility Study, Mineral Reserve estimate or independent technical report. It has not been prepared on behalf of the project owner and has not been reviewed or approved by the project owner.
The model outputs are Stormlands-generated illustrative estimates only. They should not be interpreted as demonstrated economic viability. Future technical work, including mine planning, metallurgical testing, engineering, environmental studies, permitting, capital-cost estimation and operating-cost estimation, would be required before any formal economic conclusions could be drawn.